Handbook · the order the work has to happen in · four generations, mistakes included
How to design a fast electric race motorcycle
Which decision constrains which, the order you are forced to make them in, and which of them actually move lap time. The principles are general. The numbers are ours — measured, dated, and sourced.
Why this bike exists
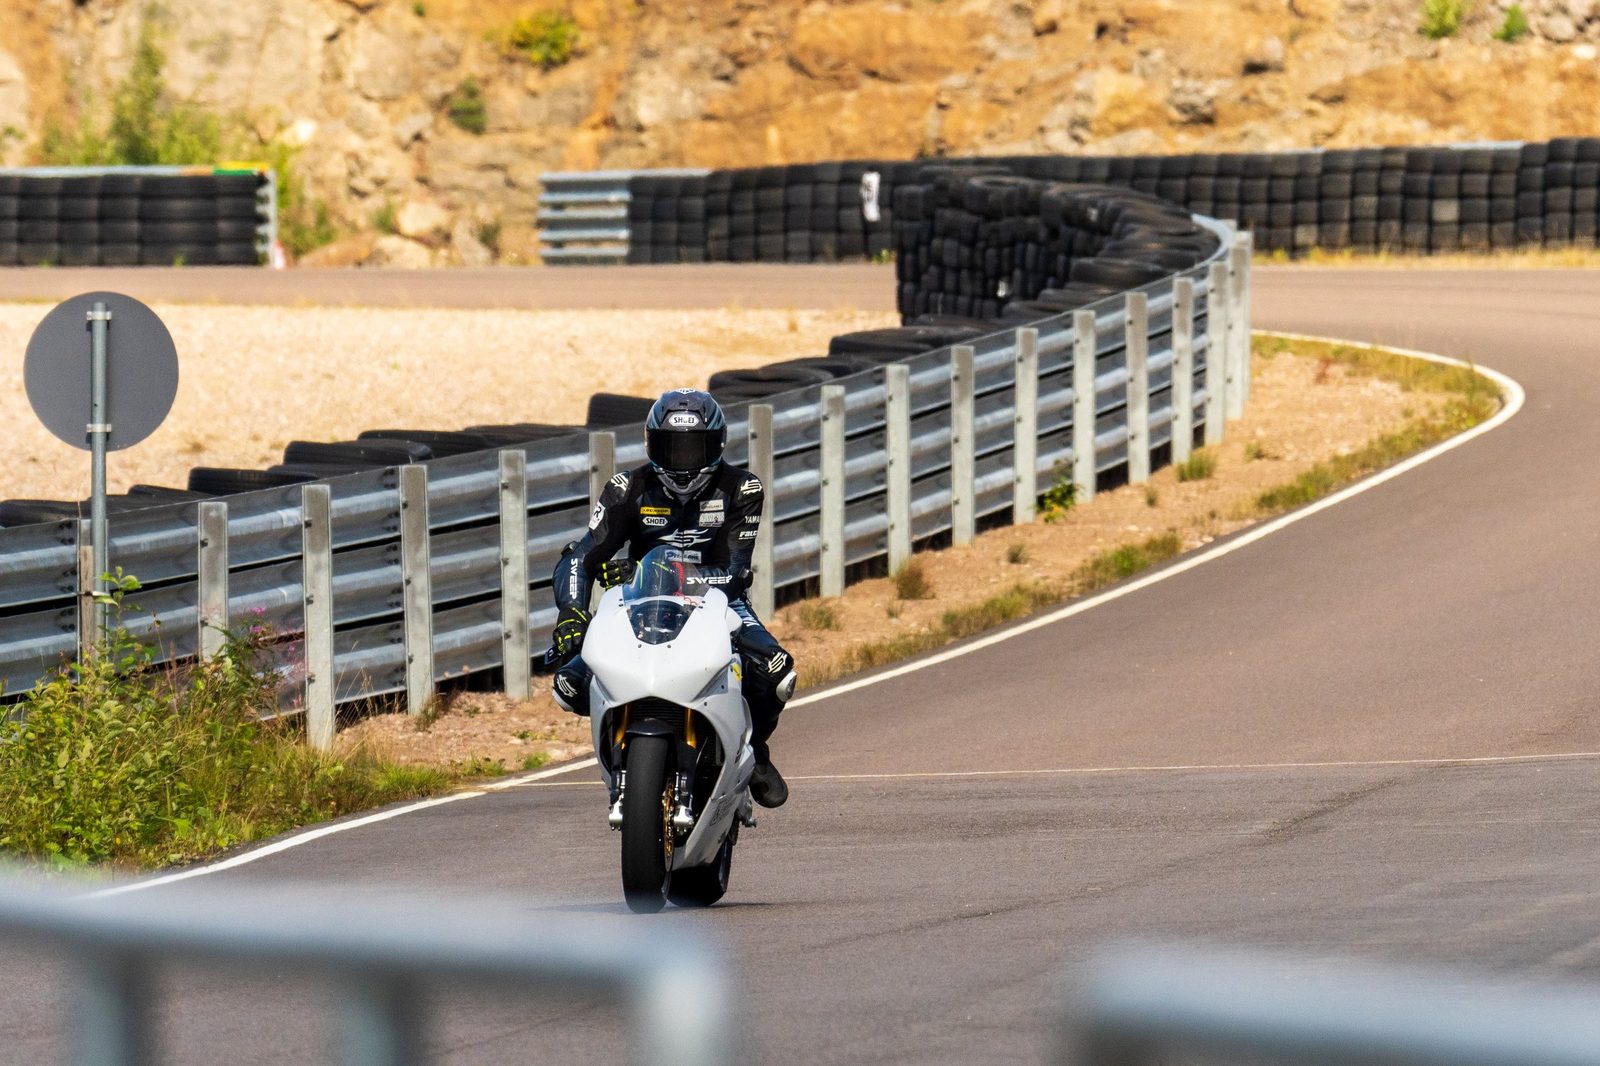
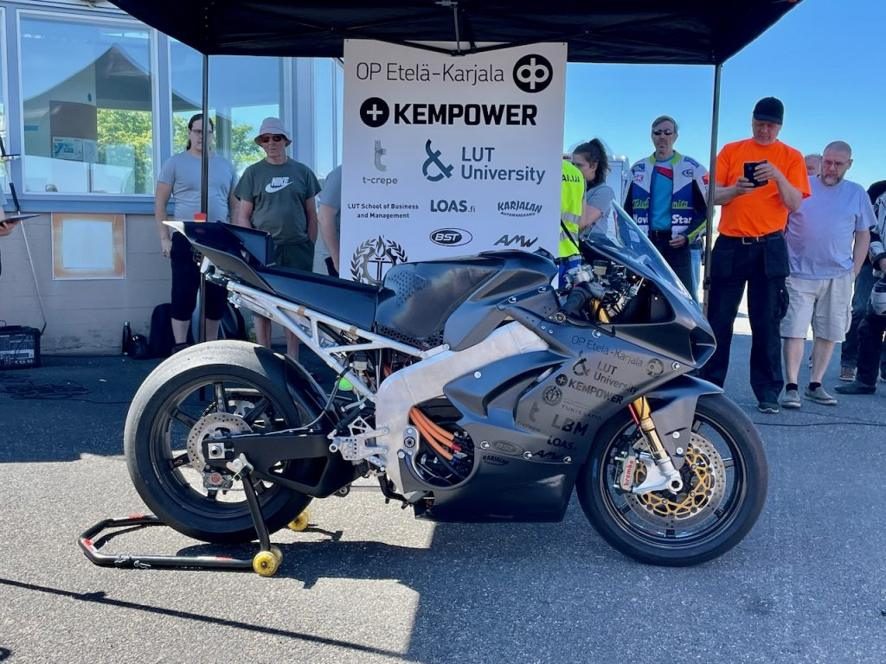
Ukkonen is a platform project at the J. Hyneman Center, LUT University. Besides the lap time, its point is to give students a practical project to put beside the theory: something with a deadline, a budget, parts that arrive late and consequences when a number turns out to be wrong. More than fifty people have worked on it. It has raced at Imatranajo (an international road race on closed public roads in Imatra, eastern Finland) and run at KymiRing, a permanent Grand Prix–standard circuit in south-east Finland that has become the project's home track. DECK
The lap time still matters, because a project like this needs a target it can't argue with. The stated ambition is the world's fastest electric race motorcycle, and that is the standard every component choice gets judged against. Not because the record is the point, but because it is what makes the engineering decisions real. A bike built to “be quite fast” never forces anyone to work out whether the pack will overheat on lap six.
It also would not exist without a motorcycle club deciding to make room for it. Motorsport is in places a conservative sport, and an electric machine in a paddock is not automatically welcome. Imatran Moottorikerho ry, the registered association that organises Imatranajo, made room: it wanted electric machinery at its event, and it gave a demonstration slot to a university project that had at that point built nothing. Martti “Simo” Solja and Sami Backman are the two people who carried that from the club's side, alongside the considerable work they have put into the meeting itself over many years. Without that slot the project would probably never have started at all. The collaboration has run every year since, to the 2026 meeting, where Ukkonen was to have led the practice sessions as course bike; it rained, and the bike stayed in the van.
That shapes this handbook too. It is written so that one subsystem can be handed to one person, and so that whoever picks it up in three years can see where every number came from. If you are that person: welcome, and start with chapter 04: the order of work is the part that will save you the most time. Keep the checklist in appendix A beside you while you work; it is the same order as twenty questions.
How to read this
General guidance and one project's case, kept apart on purpose. Only the first travels to your project unchanged.
This is a design guide, not a build manual and not a specification. It answers one question — in what order are you forced to make the decisions, and what does each one lock down? — rather than which parts to buy. Parts go out of date within a few years, while the order in which the decisions have to be made stays the same for much longer.
How the book is organised
Five parts, in the order the work has to happen. Part I is about deciding what to build: what “fast” means, how you know, and why the sequence of decisions is forced. Part II is the powertrain and the one system-level number, voltage, that most people learn about on track. Part III is the battery, and specifically heat, because heat is what ends a session. Part IV is the chassis, where the remaining lap time lives. Part V is making it work: settings, safety, and the method that keeps a three-year project's numbers trustworthy. The appendices close the book: a checklist of the order of work, the field-survey data behind chapter 01, an errata page with the open conflicts, and the list of references.
Two kinds of claim
The running text is general; it should hold for any electric race bike. Where a principle meets a concrete number from our own project, that is set apart so you can tell the two kinds of claim from each other:
Our case Mk3 · measured AiM
A block like this holds an actual decision, measurement or mistake from Ukkonen. It names which bike, when, and what was measured. Every number in it is traceable: the reference key on the right points to its entry, and the full list is in References at the end. These blocks are evidence for the general text, not recommendations to copy: your motor, your cells and your circuit will move every one of these numbers.
Rule
A block like this is the transferable rule, the thing to carry to a project with entirely different components.
In plain terms
Explainer boxes
A block like this explains a term the surrounding argument depends on (what it is and what it affects) at the point where it first carries weight, so a first-year student can follow the chapter without leaving the page. If you know the term, skip the box; nothing in it is needed twice.
Warning
A block like this marks something that goes wrong: a trap the project fell into, or one that the general text makes easy to fall into. Read these even if you skip everything else.
Limits of the evidence
A block like this says how far a comparison or a result can be pushed: what it was measured against, what it does not show, and where it stops being evidence. The warning is about over-reading the book rather than about the bike.
Five block types, five colours: copper for our case, black for a rule, green for an explanation, red for a warning and grey for the limits of the evidence. A black-ruled block tagged Summary is the same type as a rule, used to close a long section in one paragraph. Beyond these there are charts, photographs and, in chapter 08, a strip of key figures; each carries its own caption.
How to read the numbers
Every figure carries a small reference key. You don't need to open the reference to follow the argument (the text is written to stand on its own), but the key is there so that when the figure matters to your own decision you can go and check it. The list of references at the back groups them by what kind of evidence they are: a measurement of our own bike, a configuration file as it actually ran, a manufacturer's statement and a thesis carry different weight, and you should be able to see which is which.
Numbers in this handbook use a decimal point, a thin space for thousands (1 080 cells), and lap times as minutes:seconds.hundredths (2:00.50). Where the project's own sources disagree with each other, the disagreement is recorded in the errata rather than resolved silently.
Every Mk4 lap time in this book is a prediction, not a result. Mk4 has not been built. Its lap times come from a lap model calibrated to one measured Mk3 lap, 2:00.50 at KymiRing, and two of them recur throughout: the baseline, 1:57.23, and the full potential, 1:53.03. Chapter 02 shows where both come from. The differences between Mk4 configurations are more reliable than any one of the absolute times.
The four bikes
Mk1, Mk2, Mk3 and Mk4 appear throughout this book as shorthand. They are four states of one machine rather than four separate builds. Students join and leave the project continuously rather than as a year group, and at each stage the part that gets redesigned is the one expected to give the most lap time, or the most safety, for the effort, while everything else is carried over. It is worth knowing which state is which before the examples start; the closing section describes how the project runs, and the J. Hyneman Center staff who have kept it going. TEAM
Mk1 (2019–2022) began at the invitation of Imatran Moottorikerho, the club behind Imatranajo, which wanted electric machinery at its event. The work started essentially from zero: nobody in the group had particular experience of motorcycles or of electric powertrains. That included the frame. Rather than fitting an electric powertrain into a donor motorcycle, the project designed its own frame at the J. Hyneman Center, so that the motor could be placed to leave the most room for cells and the frame's width matched to the pack; it was made from welded billet parts in 5083 aluminium by LUT's prototype-manufacturing unit, LUT Voima. The same frame carried Mk1, Mk2 and Mk3, and chapter 09 comes back to what that choice buys. TEAM It was raced at Imatranajo in July 2022 against Electric Superbike Twente, a University of Twente student team from the Netherlands, and lost. That team appears throughout this book as "the Dutch team"; its machine was the Delta XE in 2022 and the Vector-ST in 2024. The bike weighed 262 kg without a rider, and on a closed airfield it reached 240.4 km/h, the fastest any version of the bike has been, and a number chapter 06 comes back to.
Mk2 (2023) was a response to two specific complaints about Mk1: the inverter's heat and the mass. The pack was rebuilt far lighter and the inverter was replaced. It was tested at Motopark (a club circuit in Virtasalmi, eastern Finland, and the project's usual test track) in October 2023, and never raced: an error in the new inverter's settings prevented proper testing for most of the season.
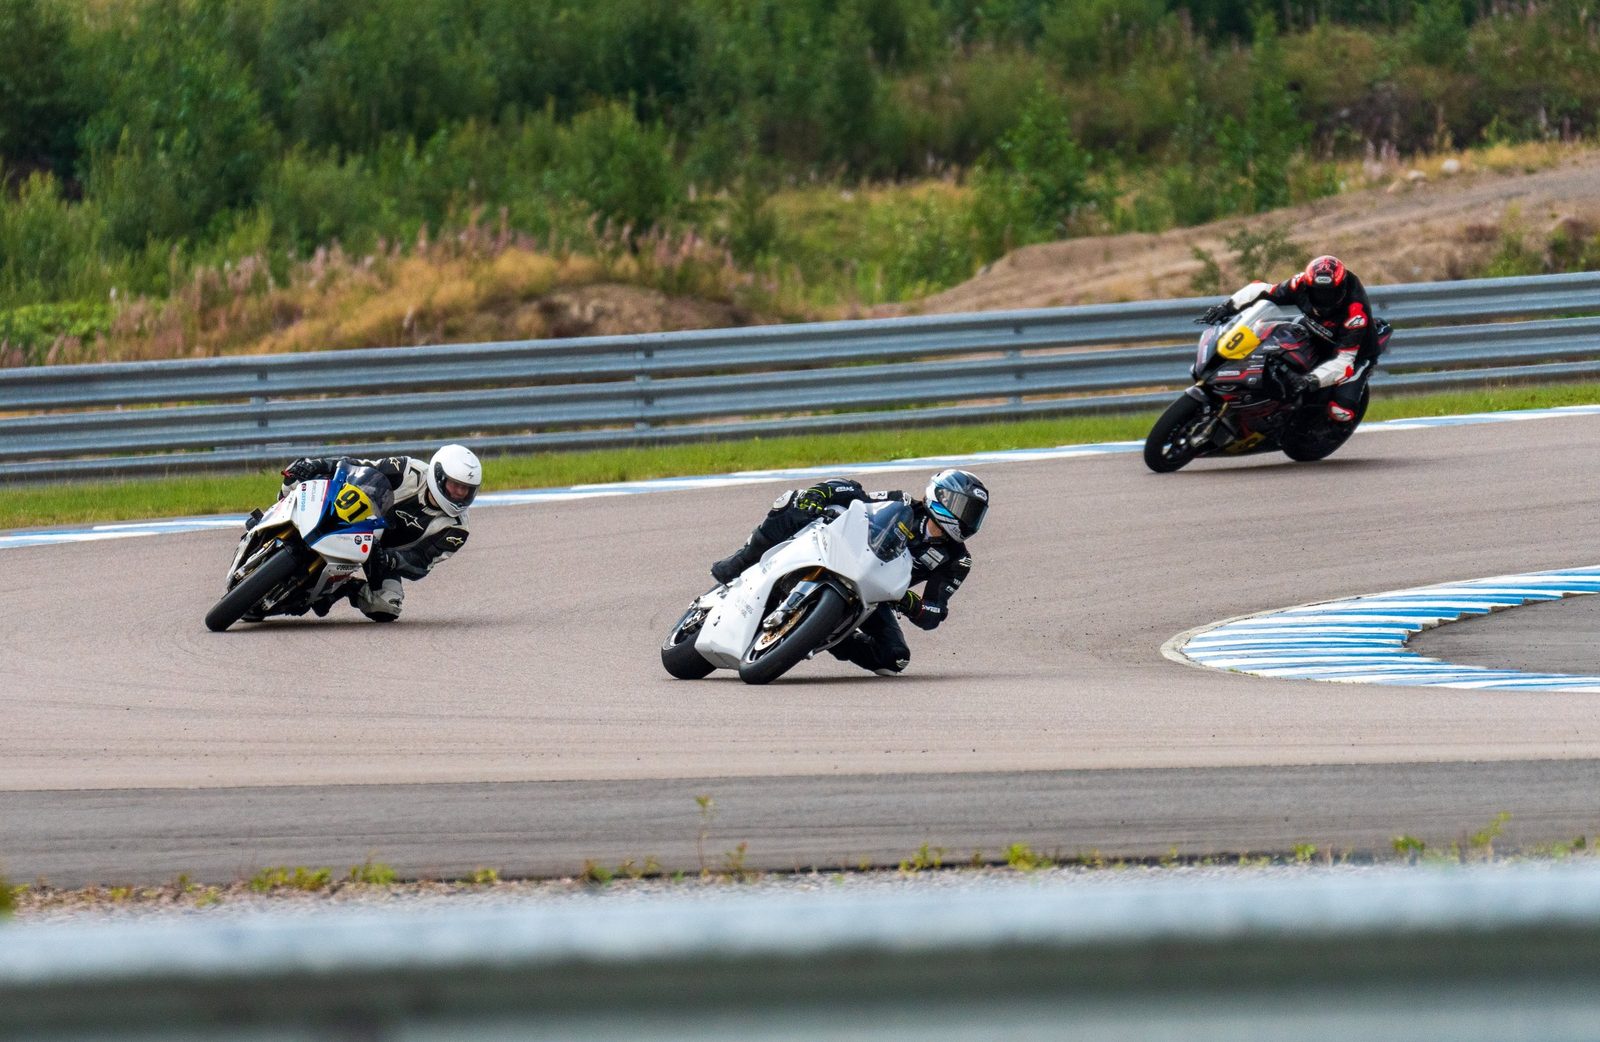
Mk3 (2024) repackaged the battery again, changed the donor swingarm for one that allowed better suspension geometry and linkage, and lightened the rear subframe. Most of the measured data in this handbook comes from it, and it is the first version that did not have to be taken apart at the end of the season. It is also the one that reversed the 2022 result, at KymiRing in 2024; chapter 01 tells that comparison carefully.
Mk4 is in design as this is written. It is not a new bike so much as an optimisation of Mk3 for a ten-lap race with the technology now available: a 180S6P pack (180 cell groups in series, six cells in parallel in each; chapter 07 explains the notation), a higher-voltage inverter, and a liquid-cooled pack. CAD work has started and, like the rest of the design, proceeds in iterations. The ten-lap race is a design specification, not a booking. The bike has always been two things at once, a race machine and a demonstrator and teaching platform, and the two count equally, as the opening of this book says. The race specification is the hardest target the project has; the closing section explains what the platform is for.
| Mk1 · 2022 | Mk2 · 2023 | Mk3 · 2024 | Mk4 · design | |
|---|---|---|---|---|
| Pack | 96S15P · 1 440 Samsung 25S 18650 | 104S6P · 624 Molicel P42A 21700 | 180S6P · 1 080 Molicel P50B | |
| Nominal voltage | ~355 V | ~374 V | ~374 V | 648 V |
| Inverter | Sevcon Gen5 S9 | Cascadia CM200DX | Cascadia CM200DZ | |
| Pack cooling | none | air, with a cordless leaf blower | air | liquid, own circuit |
| Frame | own design · welded billet 5083 aluminium · the same frame throughout | — | ||
| Swingarm | Yamaha R1 2014 | Yamaha R1 2014 | Yamaha R1 2015 | |
| Mass without rider | 262 kg weighed | — | 194 kg weighed | 219.6 kg target |
| Best measured top speed on a circuit | 215.7 km/h | 203.3 km/h | 232.3 km/h | 264 km/h predicted |
| Rider on circuits | Pauli Pekkanen | Eemeli Lahti | ||
Top speeds are the highest GPS reading from any logged circuit session, cross-checked against wheel speed, with GPS start-up artefacts removed: Mk1 at Imatranajo (1 July 2022), Mk2 at Motopark (8 October 2023), Mk3 at KymiRing on 9 August 2024, the session of the calibration lap HISTAiM. The three-generation figure in chapter 01 uses a different selection on purpose: the same circuit for Mk1 and Mk2 (Motopark), and for Mk3 the earlier KymiRing session of 13 July 2024, so its numbers are lower. Mk1's straight-line best, 240.4 km/h, was set on an airfield and is not a circuit figure.
The motor is the one thing that never changed: an EMRAX 268 MV has been in all three built so far, and Mk4 is designed around it too. That is not an accident of inertia (chapter 05 sets out why it survived a comparison with other candidates), but it does mean that everything this book says about batteries, voltage and cooling was learned around a fixed motor.
Three people have ridden the bike: Pauli Pekkanen on Mk1, Eemeli Lahti on Mk2 and Mk3, and Jere Honkanen as the reserve for straight-line testing. None of them rode it as a student of the university, and all three brought professional racing experience. Who they are, what they have won, and why an experienced rider and mechanic turned out to be the cheapest thing the project ever bought is told in the closing section. TEAM
Where this comes from, and what that limits
The handbook is written out of one project's material: three bikes built, one lap simulation calibrated against measured data, battery load tests, a dyno session, and the eighty-odd entries in the list of references, from PhD theses to manufacturer datasheets. The limits should be stated plainly. The lap simulation is calibrated on one circuit, KymiRing; the measured lap times and speeds come from several (Motopark, Imatra, KymiRing and an airfield), and each is labelled with where and when it was set, because they do not compare across circuits. All the battery experience is cylindrical cells. None of the comparisons are blind. It is one team's experience, not a literature review, and its weighting follows the mistakes: the case material is densest on heat, voltage and settings, because those three cost the most.
What transfers is wider than motorcycles. The numbers belong to one bike, but a good part of the method does not. The order of work in chapter 04, the requirement list, a reference against every number, an errata page and a written list of open questions (chapter 12), safety designed in rather than added (chapter 11), settings verified rather than assumed (chapter 10), and the paddock treated as part of the design all apply to any student engineering project that builds one machine over several years with people who come and go: a Formula Student car, a planetary rover for a university rover competition, a solar car or a rocket.
Keeping it current
The document is meant to grow with the project, by the four conventions set out in chapter 12, which are also those of the project's internal design handbook HB. The short version: every number carries a reference key, a number without one is marked as an estimate, and in the running text a number appears only in its current form. The value it replaced, and why, goes to the errata page and the decision log LOG.
Part I
Deciding what to build
Before a single component is chosen: what “fast” means on your circuit, how you would know, what actually moves lap time, and why the decisions have to come in one particular order.
Decide what “fast” means before you choose anything
“Fast” is three different design problems. On a circuit it means lap time, and lap time is not the same thing as power or top speed.
This chapter settles the metric. Everything after it is judged in seconds of lap time, so the first job is to be clear about what that measures and what it doesn't, and to see where an electric race bike actually stands against the petrol classes it shares a paddock with.
It comes in two halves. The first asks what “fast” is as a design problem; the second asks where the category actually stands, using the published field and this project's own three generations. Along the way it points forward a good deal: to the sensitivity list in chapter 03, the order of work in chapter 04, the motor in 05, voltage in 06 and mass and grip in 09. This chapter sets the questions, and the rest of the book answers them one at a time.
Three kinds of fast
You can design an electric motorcycle to be fast in three ways, and they give you three different machines:
| Goal | What it optimises | What it leads to |
|---|---|---|
| Top speed | Power against drag, for a short burst | Tall gearing, small frontal area, small pack, no cooling to speak of |
| Acceleration | Torque against grip and the wheelie limit | Short gearing, long wheelbase, low CG, small pack |
| Lap time | Average speed over a whole lap, repeatably | Grip, mass, thermal management and energy; power comes after all of those |
The third is the hard one, because it is the only one where lasting is part of the metric. A drag bike is allowed to cook itself at the finish line. A race bike isn't, because it has to do the same thing nine more times. That single difference moves the centre of gravity of the whole design job from the powertrain to thermal management, and it is the main claim this handbook makes.
The circuit is a design constraint
Lap time isn't built the same way everywhere. The rough split:
- Grip-limited circuit. Most of the lap is spent in corners where the tyre, not the motor, sets the limit. Extra power has nowhere to go. Time comes from grip, mass and centre of gravity.
- Power-limited circuit. Long straights where the bike accelerates all the way to terminal velocity. Power, aero and gearing decide it.
Most modern circuits are the first kind. Which means adding power is usually the wrong answer — and it will still feel like the right one. That is exactly why the metric has to be measured rather than assumed.
In plain terms
Grip, measured in g
Cornering grip gets quoted as a multiple of gravity. 1.0 g means the sideways force on the bike equals its own weight. A road bike on road tyres manages well under that; a race bike on slicks is somewhere around 1.4–1.5 g.
What it affects. It is the tyre's limit, and on most circuits the bike spends most of the lap sitting on it. Everywhere this handbook says “grip”, this is the number it means. Because it caps how fast you can go through a corner regardless of how much power you have, it is the reason power ranks so low in chapter 03.
Our case KymiRing is grip-limited WB s0/s1AiM
Ukkonen's home circuit is firmly grip-limited. The lap simulation values raising lateral grip from 1.40 to 1.50 g at −2.51 s, and a power increase from 135 kW (the power cap the Mk4 simulation races at) to 160 kW at −0.44 s on a single lap: about a sixth as much. Power still counts for something, because on the locked configuration about 30 % of the lap is limited by the power cap SIM; chapter 03 explains why the cap stays where it is. One pair of numbers shows why power is worth so little here. On the way out of the slow corners, the Mk4 design's tractive torque (motor torque multiplied by the gearing, measured at the rear wheel) is 843 Nm, 25 % below the 1 127 Nm the tyre would accept. On those exits the bike is limited by torque, not by the tyre and not by the power cap, which only comes into play at high speed. So more torque at the wheel would become lap time there, and chapter 05's motor comparison is that trade; the larger prize, cornering speed, is bought only with grip.
What fast looks like in the field
The second half of the chapter. Everything from here on is measurement rather than definition: first other people's bikes, then our own.
It helps to know what you are aiming at, and the answer is that the field is very small. Purpose-built electric race motorcycles with published lap times are rarer than most people assume. As of 2026 there is essentially one active programme in public view, Lightfighter in MotoAmerica's Super Hooligan class. MotoE, which ran eighteen Ducati V21Ls for Dorna and Ducati Corse, was put on hiatus after the 2025 season MOTOE; its results remain the best-documented electric racing data there is, and this chapter uses them. Mugen's Isle of Man programme ended in 2019 when TT Zero stopped. Energica's MotoE era ended in 2022. Lightning is worth mentioning, but no comparable circuit lap times from recent years are available for it. Almost everything else is a university project. CMP
In plain terms
The class ladder
The comparisons in this chapter measure electric bikes against petrol racing classes, so the classes need placing first.
- MotoGP, Moto2, Moto3
- The three Grand Prix classes, fastest to slowest. MotoGP bikes are purpose-built prototypes; Moto2 runs a common engine; Moto3 is a lightweight single-cylinder class.
- MotoE
- The electric class run at MotoGP meetings by Dorna, MotoGP's promoter, on a single make of bike: the Ducati V21L since 2023, the Energica Ego Corsa before it.
- Superbike and Supersport
- Racing versions of road motorcycles, roughly 1 000 cc and 600 cc. WorldSBK is the world championship; national championships sit beneath it.
- Entry classes
- Supertwin, Retro SBK, Super Hooligan and similar: national classes for particular kinds of road-based machine. They differ by country and are used here only as the lowest rung. Retro SBK (Retro Superbike), the entry rung at KymiRing, is the Finnish class for superbikes of model year 1999 or older, 1990s machines such as the Ducati 916 or the Suzuki GSX-R 750, prepared anywhere from near-stock to full superbike specification SRRA.
In the tables, premier, middle and entry always mean the fastest, a middle and the slowest petrol class at that circuit, taken from the same meeting where the data allow.
These bikes can't be ranked against each other, because they have never run on the same circuit. What can be done is to measure each one against the petrol classes at its own track on its own day, which is what the chart below does. That comparison turns out to be far more useful than a ranking, because the same pattern shows up every time.
In plain terms
Lap record, race pace, and why mixing them is a trap
- Lap record
- The single fastest lap ever set at a circuit by a given class. One lap, ideal conditions, new tyres, usually in qualifying.
- Race pace
- What riders actually average over a race distance, with worn tyres, fuel load and traffic. Typically a second or more per lap slower than the record.
Why it matters here. A gap measured against race pace will always look smaller than the same gap measured against a lap record. Of the five bars in the chart below, two are measured against race pace, two against outright records and one against the best laps of a shared meeting, so a bar that looks better may just have an easier baseline. That mismatch is what makes a comparison table persuasive and wrong, which is why the baseline is named on every row.
An electric lap time carries five hidden variables
The same trap has an electric-specific form. Every lap time in this chapter, the project's own included, is worth less than it looks until five things are stated beside it. Was it one flying lap or a steady pace over a race distance? The two differ by seconds on any electric bike, and by eleven on this one (chapter 08). New tyre or used? High state of charge or low? Pack voltage, and with it available power above base speed (the motor speed at which the pack runs out of voltage; chapter 06), falls with charge. Pre-cooled pack or ambient? The thermal derate starts from wherever the pack starts. And what was the session for? A time set while chasing a setting is not a time set while chasing a time. A combustion bike's lap has the first two of these; an electric bike's has all five, and a published figure that does not say which of them applied is not comparable with anything, including the same bike a week later. The Lightfighter team has put the same questions in public about its own lap times: flying lap or race distance, qualifying tyre or worn slick, high or low state of charge, pre-cooled pack or not LFFAST. Chapter 12 turns this into a logging requirement.
Where that puts them on the petrol ladder
A gap to the premier class is abstract. It gets concrete when you ask which petrol class an electric bike would actually be racing. Most circuits run a ladder of three or four classes, and measuring against all of them rather than just the top one is what makes the position legible.
| Bike | Circuit | vs premier | vs middle | vs entry |
|---|---|---|---|---|
| Ducati V21L test lap | Jerez 2023 | +11.5 % | +7.4 % | +2.6 % |
| Ducati V21L | Assen 2023 | +7.8 % | +3.7 % | −1.4 % |
| Ducati V21L | Mugello 2023 | +8.4 % | +3.9 % | −0.5 % |
| Energica Ego Corsa | Jerez 2021 | +11.9 % | +7.9 % | +3.0 % |
| Mugen Shinden Hachi | Isle of Man 2019 | +11.5 % | +7.0 % | +2.1 % |
| Lightfighter V3-RH | Barber 2026 | +4.9 % | +1.5 % | — |
| Ukkonen Mk3 measured | KymiRing 2024 | +8.5 % | +4.2 % | −2.6 % |
Read the last column, and read it across the three Ducati rows. The best-funded electric race motorcycle in the world and a Moto3 bike set nearly the same lap time: a percent or so faster at Assen and Mugello, on laps from the same meeting, and 2.6 % slower at Jerez, where the Ducati figure is a test lap set against Moto3's race record and is the weakest row in the table. Moto3 is the entry class of Grand Prix racing: a 250 cc single-cylinder bike weighing about 80 kg with 40 kW. The Ducati carries nearly three times the power and nearly three times the mass, and arrives at the same number. That comparison does more to locate electric powertrains than any of the others in the table.
The spread across the three circuits is itself informative, and it comes back below: the electric bike's deficit is smallest at the fastest, most flowing circuit and largest at the tightest one.
The same shape repeats. Mugen, which through the Isle of Man speed trap was quicker than a Supersport bike, finished 2.1 % off the Supertwin record. Ukkonen Mk3 is already faster than the Retro SBK pace at KymiRing and sits mid-field in Supersport. So the summary of where electric powertrains stand on a road circuit today is this: they place around the entry and lower-middle of the petrol ladder, not near the top of it, while carrying two to three times the power of the class they're matching.
Don't over-read this table
The three columns are not the same thing from row to row. Moto3, Supertwin and Retro SBK are entry classes at their own circuits, but they are not equivalent to each other: different machinery, different fields, different eras. And the baselines are mixed: Jerez and the Isle of Man use outright records, the Assen and Mugello rows use best race laps from one shared meeting, and Barber and KymiRing use race pace, which is the softest number of the three. The pattern down each column is real. Individual cells across rows are not comparable, and a “fifth fastest in the world” claim cannot be built from this. Every row is also tied to the cells of its year. The best commercially available lithium-ion cells more than tripled their specific energy between 1991 and 2018, from about 80 to over 250 Wh/kg, and they got there in small steps year by year rather than in jumps ZIEGLER. A 2019 lap was set with the cells of 2019, and that alone makes it harder to compare with a recent one.
The data behind this section is in appendix B: the reference times each percentage is calculated from, the official records and same-weekend laps at three circuits MotoE visits, how the surviving programmes reach their torque, and the pack architecture compared line by line with the MotoE bike. Its short version is two findings. Whichever baseline is used, MotoE sits seven to eleven percent off the front, so the choice of yardstick does not change the answer. And the size of the gap depends on the circuit in the way the mass argument predicts: smallest at fast, flowing Assen, largest at tight, stop-and-go Jerez. It tracks the number of hard accelerations per lap, which is the signature of a machine limited by acceleration rather than by grip or top-end power; the explainer later in this chapter has the algebra.
What's actually holding them back
More interesting than the size of the gap is where it is, and the answer differs from bike to bike, which is itself the finding.
- Mugen went through the Isle of Man speed trap at 176 mph (faster than the Supersport bikes) and still lost 7 % on lap time.
- Lightning is a maker of road motorcycles rather than a racing programme, but it has raced race-prepared versions of its bikes, and they are the sharpest version of the point. The LS-218 ran 351 km/h at Bonneville and won Pikes Peak outright in 2013, ahead of the combustion motorcycles LSWIKI. It is worth mentioning, but no comparable circuit lap times from recent years are available, so it has no place on the ladder above.
- Ukkonen Mk3 is the opposite case. At 232 km/h it is markedly slower than a Supersport 600 down the same straight (and that particular number is not an aerodynamic limit or a power limit but a voltage one, which chapter 06 takes apart), and it still lands mid-field in that class on lap time.
Seen from the road circuit, the first two are the category's stereotype: top speed in hand, lap time missing. The third case breaks it, and it is the most useful of the three, because a bike that gives away the straight and still runs the class pace has to be getting that time back somewhere. It is getting it back in the corners.
Our case KymiRing 2024 · 311 km/h, and what it did not buy TWENTELUT
The clearest illustration this chapter has comes from a weekend the project was at. On the day both machines were on track together, on slicks, Mk3 lapped in 2:02 and the Dutch team's Vector-ST in 2:16. That is the nearest thing to a like-for-like comparison the project owns: same circuit, same day, same conditions, two electric bikes. There was no official timing in that session: Mk3's figure, 2:02.588, is its best lap from the bike's own AiM logger and GPS data, set in traffic AiM; the Dutch team's is their time that day as reported by the university. The race itself was rained off.
The straight tells the opposite story. On the long straight their machine recorded 311 km/h, by the team's own live account: 79 km/h more than Mk3 has ever seen on a circuit. That figure comes from a track day the following morning, when Ukkonen had already left the circuit; running on wet-weather tyres, on a morning their own blog expected to turn dry, they set 2:15.146 over two push laps. So their machine plainly had more in it than 2:16, and this case says so rather than leaving it out.
It does not change the conclusion; it sharpens it. A machine that would show nearly eighty kilometres an hour more down the straight was fourteen seconds a lap slower on the day the two bikes shared the circuit, and even its own best of the weekend was thirteen behind. The straight is where top speed is visible. It is not where a lap is made — and this is one of the few cases where both halves of that were measured on the same asphalt, in the same weekend, by two teams working next to each other.
Our case Mk3 · where the lap actually goes AiMWB s0/s1CMP
Decomposed from the measured 2024 lap rather than assumed, Mk3 is three different bikes in one:
| Phase | Measured | Verdict |
|---|---|---|
| Mid-corner, lateral | 1.49…1.51 g | At or above class |
| Corner exit, longitudinal | 0.62 g | Less than two-thirds of a 600 |
| Straight | 232 km/h | Slower than the class |
So the bike corners well and accelerates badly. The lateral figure is measured in four corners, and 31 % of the lap is spent above 1.0 g; those are peaks, and the corner-by-corner 99th percentile is 1.38 g, which is what the simulation's 1.40 g is based on. The peaks are why the grip line in chapter 03 is an opportunity rather than a complaint: the tyre has already given more than the model assumes, briefly. A petrol 600 is at its wheelie limit around 1.0 g on the exit, where Mk3 manages 0.62. What it cannot do is use the tyre on the way out. Mk3 puts 579 Nm to the rear wheel, and the exit figure above is what that buys: two-thirds of a 600's. The same shortfall stated as a design target is in chapter 05's motor figure: Mk4 aims at 843 Nm and the tyre would take 1 127.
In plain terms
Why a heavy bike can still corner
The intuition that weight ruins cornering is mostly wrong, and the algebra says why. In a steady corner the tyre makes a sideways force of roughly μ·m·g, and the resulting acceleration is that force divided by the mass, so the mass cancels and what's left is a ≈ μ·g. Two bikes on the same tyres reach a similar lateral g whatever they weigh. The same goes for the tipping limits: how hard you can brake before going over the front, or accelerate before looping, is set by wheelbase and centre-of-gravity height, not by mass.
So where does mass actually cost you? In the places where you are limited by the drive force the powertrain delivers rather than by the tyre. Acceleration out of a corner is a = F/m directly, so if the motor can't reach the tyre's limit anyway, every kilo is a straight subtraction. Add direction changes, where you're fighting inertia, and tyre temperature and wear over a full race distance.
Second-order effects do favour the lighter bike (tyre grip falls off slightly as load rises), but they are small next to the acceleration term. This is why an electric bike can match the class through a corner and lose the lap on the way out of it.
Which sharpens the diagnosis for the whole category. The deficit lies in acceleration rather than in cornering grip or in power as such, and mass is the biggest term in acceleration. MotoE's Ducati weighs 224.5 kg without a rider; a Moto3 bike weighs about 80 kg and has 40 kW, and with the whole MotoGP infrastructure behind it Ducati Corse beats that Moto3 bike by only a percent or so on a good day, against a machine with a third of its mass and a third of its power. When MotoE changed generations, the fix was 35 kg, not more power. CMPDUCATI
Lightfighter looks like an exception, and on closer reading supports the same conclusion. Its V3-RS is published at 181 kg ready to race, with 115 kW LFV3NEWATLAS, and its Super Hooligan version, the V3-RH, is the measured electric bike closest to the petrol classes: 1.5 % off Supersport at Barber, against a softer race-pace baseline. Take the mass problem away and most of the gap goes with it. It got there by packaging for its race length: pouch cells, a pack of about seven minutes at full throttle, and eight-lap races FARASISCMP. It is the balance between energy and mass that chapter 07 works through for Ukkonen's ten-lap specification, struck for a shorter race; appendix B has the detail.
Summary · what the field tells you
The electric race bike's problem is acceleration, and mass is the biggest term in it. It has never been power on paper. And mass and range are one decision: the pack that sets how long the bike can run at full power also sets most of its mass. With today's cells a bike can be light, or it can carry the energy for a long race at full power, but not both.
This isn't one team's failure to solve something; it's the state of the whole category, and it's visible in the published results. The heavier bikes carry the energy for their race distance and pay for it in acceleration. The one bike that has got its mass down has done it by packaging carefully for the shorter races it runs. Note also what the problem is not: these bikes are not slow through corners. Assuming they are sends the work to the wrong place.
The same argument, in one project's own history
Everything above is drawn from other people's bikes. A project's own generations are a better test, because the circuit, the logger and the processing can be held constant while the machine changes, and because nobody can accuse the result of being selected. This project has three generations of logged data and had never plotted them against each other.
The pattern is the one the rest of this chapter argues for, and it is stronger in the project's own data than in the published field. Three winters of work moved top speed by a tenth and cornering by almost a half. The generation that could not corner was also the generation that had the most power available on paper, because Mk1's pack was the largest of the three.
Our case Mk1 · 262 kg, and what it did to the corners HISTLUT
Mk1 weighed 262 kg without a rider (weighed, not estimated). Across every logged session at two circuits it never reached 1.0 g of lateral acceleration. The rider's own summary at the time was that the weight made the bike hard to turn into a corner, and the data is consistent with it, within the limits the caveat below sets out.
This is the single most useful thing the early bikes left behind, because it is the argument of chapters 03 and 09 stated as a measurement rather than a sensitivity. Mass does not stop a bike cornering through the tyre; the algebra earlier in this chapter says the mass cancels. What it does is make the machine slow to change direction and hard to place, and it loads the tyre harder for the same grip, so the rider never finds the limit. The lap time was lost in the corners, and the reason was in the mass, but not through the route the algebra predicts.
Read this comparison carefully
Three things changed between these generations besides the bike: the rider changed after Mk1, the tyres and setup changed with every version, and the Mk3 row is a different circuit. None of that can be separated in this data. The comparison establishes the direction and the rough size of the gain; it cannot attribute it. It is put here as evidence that the priority list in chapter 03 points the right way, not as a measurement of any single change.
The other column: what the electric architecture gives back
This chapter has so far been an account of what an electric race bike gives away: the straight, the corner exit, the mass it carries to get there. Before it closes, the other column of the ledger: what the same architecture gives a race bike that a combustion one cannot have. Everything so far in this chapter is a deficit, and read on its own it makes a poor case for building the thing at all. That is not the whole picture, and the balance belongs here rather than in a chapter of its own — a book that lists advantages separately is advocating, and a reader is entitled to see both in the same place.
Some of what an electric powertrain gives back is worth lap time and some is not, so they are worth separating.
| What | Which way | Where it is dealt with |
|---|---|---|
| Torque is commanded and known, not estimated from a map | better | Ch 10 · the basis for any slip control |
| Torque changes in milliseconds, in arbitrarily fine steps | better | Ch 10 · resolution matters more than speed |
| Drive and regeneration are one control law; engine braking is mapped | better | Ch 10 |
| No gearchanges: no torque interruption, no pitch disturbance at lean | better | Ch 05 · and it is why the whole motor choice is one product |
| Rotation direction is nearly free to choose | better | Ch 09 · gyroscopic cancellation |
| Mass placement is designable; no fuel moving about | better | Ch 09 |
| Mass, and the whole of chapter 03's sensitivity list | worse | Ch 03, 07, 09 |
| Mass does not fall during the race as fuel does | worse | Ch 10 |
| Heat is stored in the pack rather than thrown out of a pipe | worse | Ch 08 · this is what ends the session |
| The rider cannot hear the rear tyre spin up | worse | Ch 10 · an argument for traction control, not a detail |
Read together, the two halves say something more useful than either does alone. The deficits are in the physical plant and the advantages are in the control of it. That is a real asymmetry, and it points the work: the seconds that are missing come back through mass, grip and heat, which are mechanical problems; what the architecture hands you for free is precision, which is only collected if somebody builds the controller to collect it. Neither half substitutes for the other, and a project that spends all its time on one of them is leaving the other on the table.
Put a number in seconds on every development item
The practical reason to do this is work order. A project always has more good ideas than hours. When every item carries a value in seconds, two competing ideas don't need an argument; the number settles it. Without one, priority gets decided by whatever is most fun or most obvious, and that is rarely what is fastest.
Rule
Give every development item a value in seconds before it goes on the list; without one it is only an opinion.
The value may be rough, but it must be there, or the priority gets set by something other than lap time.
The vehicle model — where the seconds come from
A simple point-mass model is enough, as long as it is calibrated against one measured lap. What the model produces is sensitivity, not an absolute lap time.
This chapter settles how you know. Every value in seconds in this book comes from a lap simulation, and the simulation is only as good as the one measured lap it was calibrated to. So the calibration point and the outside check on it are worth more than any amount of model sophistication.
What the model needs to be
A lap simulation doesn't have to be sophisticated to be useful. A point-mass model that knows mass, the torque curve, gearing, drag, a grip limit and the track geometry will give you sensitivities you can work with. Tyre models, suspension kinematics and a rider model sharpen the absolute number, but they rarely change which of two development items is bigger, and that is the only thing the model is used for. If you want a worked example of the full version, a validated electric race motorcycle model with a Pacejka tyre model, an entropic battery thermal term (the small reversible heat a cell produces or absorbs as it charges and discharges, separate from ohmic loss) and motor and inverter loss maps exists in the literature FLA, and it is also where usable starting values for drag and mass sensitivity come from.
Calibration is the whole value of the model
An uncalibrated simulation just tells you the consequences of your own assumptions. Calibrating means forcing the model to reproduce one real, measured lap, and solving the coefficient that cannot be set any other way from that: here the rider factor. The rest are set from measurements or stated as assumptions (grip from the logged lateral acceleration, drag from the energy balance on the long straight, drivetrain efficiency assumed). Only after that does a predicted change mean anything.
Two things follow. First, the calibration point is sacred: change it and every prediction moves with it. Second, only a measured clean lap will do, not an official result. Official times include traffic, flags and a standing start. The model has none of those.
Our case the one lap everything is calibrated to AiMWB s6/s10
The calibration point is a clean lap of 2:00.50 by Eemeli Lahti at KymiRing on 9 August 2024. It is not a lap the logger recorded as such: the logged best was 2:02.588, set in traffic, and the rider estimated the traffic at about two seconds. That estimate was then checked against the sector times on the AiM MXL2 data, which support it TEAM. So 2:00.50 is a measured lap corrected by a verified estimate, and every prediction in the book moves with it. Who set it matters as much as what it reads: the rider was two weeks from winning the Finnish Superbike championship ESS, and it was his second outing on the machine; he had ridden it at the same circuit in July and specified setup changes that were made before this session. So the lap is close to what the bike had to give, from a rider who knew it, and the rider factor below is a property of the model rather than a measure of how hard somebody was trying. Fitting the model to it used a torque constant of Kt = 0.8265 Nm/Arms, measured rather than read from the datasheet (the newton metres the motor makes per amp, which chapter 05 explains), and gave a rider factor of 1.0773. Both numbers are correct, but they mean different things: 2:02.588 is what the session produced, 2:00.50 is what the bike did without traffic, and mixing them up would shift the entire prediction series by two seconds.
What the rider factor is, and how it is used. It is a lap-time multiplier: the measured lap divided by the simulated one, 120.50 s / 111.86 s = 1.0773. The point-mass model rides a perfect lap; a real rider leaves a margin, and the factor carries that margin into every prediction. Every Mk4 lap time in this book is the simulated lap multiplied by the same factor, t = 1.0773 × tsim, which assumes the same rider riding with the same margin to a different machine. Because the factor is solved from one lap, with the grip limit set from the logged lateral acceleration and the drivetrain efficiency assumed, the absolute predictions are only as good as that lap and those inputs, and the workbook itself names this the weakest point of the model: a second lap at a different current limit would show whether the factor is a constant WB s6. The differences between configurations are much safer than the absolute times, which is the reason chapter 03 is written in differences.
The same log also gives the per-cell current the pack actually saw: 24 A RMS over the lap and 39 A at peak, on a pack of 624 cells. Those two figures anchor most of Part III.
Validate against somebody else's measurement
Your own calibration tells you the model reproduces your bike. It doesn't tell you whether the model's sensitivity is right: whether it predicts the size of a change. For that you need a case where somebody else made a change and measured the result.
Our case three independent checks on mass sensitivity CMPWB s15FLA
The MotoE switch from Energica to Ducati is the nearest thing to a natural experiment: same series, same circuits, same riders, with the caveat in appendix B.2 that the Ducati lap is a 2023 test lap and the Energica lap a 2021 race lap. Energica at 110 kW / 220 Nm / 260 kg ran 1:47.473 at Jerez; Ducati at 110 kW / 140 Nm / 224.5 kg ran 1:47.053. Torque dropped 36 %, mass dropped 35 kg, power stayed put — and the bike got 0.4 % faster. Our simulation gives 0.49 % for a 25 kg reduction. Flanagan's validated model gives 0.021 s/kg at Pikes Peak; ours gives 0.024 s/kg at KymiRing. Three routes, same order of magnitude, and that agreement is what the correction in chapter 03 rests on. It is agreement in order of magnitude, not in the second digit: taken raw, the MotoE change is about 0.012 s/kg (0.42 s for 35.5 kg), with a 36 % torque cut mixed into it, and Flanagan's figure comes from a hill climb rather than a two-minute circuit lap.
Rule
Calibrate the model against your own measurement, then validate it against somebody else's.
Calibration alone makes a model that reproduces itself. Only an outside case tells you whether it can predict a change.
What the model predicts for Mk4
Mk4 has not been built, so it has no lap time. What it has is a prediction, and the chain behind it is short. The logged Mk3 lap of 2:02.588, less the traffic, is the 2:00.50 calibration lap. The model fitted to that lap is given the Mk4 configuration in place of Mk3's. The simulated lap, multiplied by the same rider factor, is the Mk4 figure. Every Mk4 lap time in the rest of the book is that chain, run on a different configuration.
Our case the two Mk4 numbers WB s0-B
The baseline, 1:57.23. The locked configuration of chapter 04 (EMRAX 268 MV, 180S6P, 135 kW power cap, overall ratio 2.50, 328.0 kg with rider, lateral grip 1.40 g, braking limit 1.10 g), simulated on 11 September 2026 with the measured torque constant and the rider factor above. It is what the model says Mk4 would do as specified today, ridden with the margin Mk3 was ridden with on the calibration lap. Two figures a tenth either side of it appear later and are not rivals: 1:57.20 in chapter 05 is the same configuration re-run inside the motor comparison, and 1:57.30 is the same before the mass correction of 11 September (330.9 kg). The single-change bars in chapter 03 were computed from that earlier run and differ from the current baseline by under a tenth.
The full potential, 1:53.03. The baseline with the whole development list of chapter 03 applied in order: regeneration and a lower centre of gravity, the mass target, and lateral grip rising to 1.50 g, which assumes the wider 200/60-17 rear tyre if it fits the swingarm. The 1.50 g is a target: Mk3 has touched 1.49–1.51 g in four corners, but its typical cornering level is 1.38 g, which is why the baseline uses 1.40 g. Chapter 03 builds the full potential step by step.
Put against the field of chapter 01, the prediction looks like this.
| Bike | Lap | vs Superbike | vs Supersport | vs Retro SBK |
|---|---|---|---|---|
| Ukkonen Mk3 measured | 2:00.50 | +8.5 % | +4.2 % | −2.6 % |
| Ukkonen Mk4 baseline predicted | 1:57.23 | +5.5 % | +1.4 % | −5.3 % |
| Ukkonen Mk4 full potential predicted | 1:53.03 | +1.7 % | −2.2 % | −8.6 % |
The two Mk4 rows carry everything that is uncertain about the calibration: one lap, one rider, one day, and a rider factor assumed to be constant. They say where the configuration would sit if the model's absolute level is right. The step from one row to the next is the safer reading.
What actually sets lap time
Grip, then the braking limit, then mass. Power is worth something on a single lap, and the race, not the lap, decides how much of it you can use.
This chapter settles the priority order. Once you have the numbers in seconds, the ordering usually comes out the same on any grip-limited circuit: grip first, then the two ways of using the tyre harder in braking, then mass, then a long tail. The gap between the top and the bottom is two orders of magnitude.
One term needs fixing before the chart. The braking limit is the hardest deceleration the simulated bike is allowed to use. It is capped by the rear wheel lifting — the stoppie limit, which a lower centre of gravity raises (chapter 09 has the geometry) — and extended by letting the rear wheel do some of the braking through regeneration. That is why the two appear in the chart as one bar.
The baseline is Mk4 at 1:57.23, the prediction defined in chapter 02. Applied in order rather than one at a time, the top of the list is the development path the project is working to, and its end point is what this book calls Mk4's full potential:
| Step | Lap | What it takes |
|---|---|---|
| Baseline, locked configuration | 1:57.23 | Chapter 04's list as it stands; 328.0 kg with rider |
| + braking limit 1.10 → 1.25 g | 1:56.34 | Regeneration of 60 Nm at the rear wheel and a centre of gravity 50 mm lower |
| + mass −33.4 kg | 1:55.55 | The whole target column of the mass budget; 294.6 kg with rider |
| + lateral grip 1.45 g | 1:54.26 | Tyres, setup and riding time |
| + lateral grip 1.50 g · full potential | 1:53.03 | A target: the level Mk3 has touched at peak in four corners, held everywhere; assumes the 200/60-17 rear tyre if it fits |
Why the power cap stays at 135 kW
On a grip-limited circuit much of the lap is spent where the tyre is already at its limit: corner entry, mid-corner, corner exit. Extra power does nothing there, because the grip is spent. On Mk4's locked configuration, with an overall ratio of 2.50 and an rpm ceiling at 264 km/h, about 30 % of the lap is limited by the power cap, and there 25 kW more is worth 0.44 s on a single lap SIM. So for one lap, more power helps.
The reason not to take it is the race. The 135 kW cap is sized for ten laps: at that power the cell current and the heat stay within limits and the energy lasts to the flag (chapters 04, 07 and 08). More power is a qualifying setting, not a race setting. On an electric bike, what the pack can deliver for the whole race sets the power more than what power is worth on one lap.
Aero is worth little for a related reason. Cutting drag only buys time if you have rpm headroom left on the straight. If the bike is already against its speed ceiling before the braking marker, a better CdA just gets you to the same ceiling sooner. For reference, a coast-down measured CdA of 0.335 and a sensitivity of 0.22 s per CdA point on a comparable machine FLA are the right order to sanity-check your own figure against.
In plain terms
CdA
Drag coefficient multiplied by frontal area: one number that combines how slippery the shape is with how big it is, in m². A motorcycle with a rider on it is typically somewhere around 0.3–0.4 m². You can't usefully compare the two halves separately, which is why they're quoted as a product.
What it affects. Drag force grows with the square of speed, so CdA only earns its keep where the bike is actually fast. That makes it a top-speed parameter far more than a lap-time one, and on a circuit with short straights it is close to irrelevant.
The list of things that don't matter is just as useful
Write that one down separately and keep it visible. Its job is to stop work drifting into things that feel productive. On this circuit it is three items long: aerodynamic drag 13 % lower, 0.11 s; moving the gearing anywhere between 2.4 and 2.7, 0.05 s at most; rolling resistance 30 % lower, 0.01 s. Together they are worth under two tenths of a second, less than a tenth of what grip alone is worth. Without the list, a team spends the winter on aerodynamics and gearing and collects a tenth or so for the trouble.
Rule
Grip and braking before mass, and all three before power. Always, until your own simulation says otherwise.
If grip goes up, everything else improves with it — including the torque that was previously going up in smoke. If power goes up and grip doesn't, nothing happens at all.
The order you are forced to work in
Some choices are the boundary conditions for others. Done in the wrong order, they get done twice.
This chapter settles the sequence. There is a chain in electric powertrain design where each link constrains the next. You can walk it in any order you like, but only one order avoids throwing work away. The classic expensive mistake is picking the cell and pack size first, which feels natural because the battery is the biggest single purchase, and only later discovering that the inverter's voltage ceiling, or the number of cells the BMS (the battery management system that monitors every cell) can handle, dictates the series count, at which point the entire pack geometry gets recalculated.
Our case a pack designed before the voltage was settled LOG 10 Sep 2026
During Mk4 design a 100S8P pack (800 cells, about 14.4 kWh, five modules) got as far as a module layout, wiring scheme and dimension chain before the voltage ceiling was finally settled. When the inverter was locked to a unit with an 840 V window and the BMS's 180-cell maximum became known, the configuration moved to 180S6P and the entire physical layout had to be redone. The design method carried over to the new configuration; the geometry had to be drawn again.
The chain above is the one you can draw. There is a second kind you can't.
The sequence in the diagram is a chain of specifications: each link hands the next one a number, and it can be drawn in advance because every quantity in it belongs to somebody. The couplings that actually hurt are the other kind: where a decision in one subsystem silently removes an option in another, through geometry rather than through a number. Nobody writes those down, because at the moment the first decision is made the second subsystem has no reason to object. They surface in the workshop.
There is no general method for finding them in advance. There is a partial one, and it is cheap: whenever a decision fixes which physical face of a component gets used for something, ask what else that face was for. Cooling, current, mounting and sealing all compete for the same surfaces, and a component has only so many.
Our case the cooling decision chose the welding problem HUSUASIRV
A 2025 bachelor's thesis for this project designed a liquid-cooled 36-cell test module, cooled from underneath by a pressed aluminium cold plate, a shallow sealed plate with coolant running through it, which chapter 08 returns to. Cooling from the base means the cell's flat negative end has to sit against that plate. That single requirement quietly deletes the standard way of interconnecting cylindrical cells, in which every second cell is inverted so each busbar lands on two flat faces.
With every cell the same way up, both connections have to be made from the top: the positive cap, and the negative crimped rim of the can, where the flat land is a few tenths of a millimetre wide. The process tried was laser welding, and laser welding needs two flat surfaces in contact; chapter 07 adds the metallurgical half of the problem. Over the whole project not one busbar was successfully welded to a cell, including on a purpose-built practice module with empty cell cans. The cold plate was pressed, assembled and pressure-tested; its cooling performance was never measured, because there was no way to put current through the module.
Nobody made a mistake. The thermal requirement was correct, the interconnect layout was ordinary practice, and neither document mentioned the other. The coupling existed from the first week and was discovered in the last.
Rule
Settle the series count before the parallel count, and both before you order cells.
Series count is the intersection of three hard ceilings: the inverter's voltage window, the BMS cell count, and motor insulation. Parallel count is a continuous variable set by current and heat. Hard ceilings first.
And once a face of a component has been claimed (for heat, for current, for mounting), write down which one, and put it where the other subsystems will read it.
The same order, turned into twenty questions with what each one locks, is the checklist in appendix A. It is the page to keep open while you work.
Mk4 as it stands: the requirements, and what is locked
Two tables close the chapter, because the rest of the book keeps returning to them. The first is the set of requirements the Mk4 design is sized against; each of them moves the pack, the cooling or both, so each carries where it came from and what changing it would cost. The second is the configuration as it is currently locked, gathered from the chapters that decided it. Locked means it is not reopened without new measured data; to confirm means the choice is made but waits for a check; open means the question is still live.
| Requirement | Value | Where it comes from | What changing it costs |
|---|---|---|---|
| Race distance | 10 laps of KymiRing at full pace | National races at KymiRing run eight to ten laps; the design takes the longer one WB s2/s7 | Ten laps are why the pack has 1 080 cells: the 900 already bought would carry about 48 A each at peak, 1.44 times the heat, and do not last ten (chapter 07) |
| Power cap | 135 kW | A race setting, not a hardware limit: the energy and heat a ten-lap race allows. At 180 kW one qualifying lap is possible, but ten laps would use 19.0 of the pack's 19.4 kWh WB s9 | Raising it to 160 kW would be worth 0.44 s on a single lap (chapter 03), at the cost of the ten-lap heat and energy budget; lowering it costs lap time quickly (110 kW, 1.3 s) |
| Regeneration | 15 % of the braking energy recovered (about 7.5 % of the traction energy); 60 Nm at the rear wheel | A modelling assumption, not a measurement: Mk3 recovered under 2 %. The 60 Nm is set by corner entry, not energy (chapter 10) | Without it ten laps finish at 6.7 % charge instead of about 14 %; 30 % would add about three-quarters of a lap of margin |
| Cell temperature | ≤ 60 °C, hottest cell | Upper end of the cell maker's discharge range, and where the inverter's current table starts to cut CC §09 | Chapter 08 explains why running hotter is not worth it |
| Coolant | ≤ 30 °C at the pack inlet; radiator sized for 25 °C air | The cooling-channel document's design point CC §08; chapter 08 sets it against Finnish summer temperatures | 35 °C coolant needs 20 % more cooling; 40 °C needs 50 % more |
| Mass | 219.6 kg without rider (target) | The mass budget MB | About 0.024 s a kilogram (chapter 03) |
| Item | Choice | Status | Decided in |
|---|---|---|---|
| Motor | EMRAX 268 MV, 5 500 rpm assumed (O19) | locked | Ch 05 |
| Inverter | Cascadia CM200DZ, 400 Arms peak / 200 Arms continuous | locked | Ch 06 |
| Cells and pack | Molicel P50B, 180S6P, 1 080 cells, 19.4 kWh | locked | Ch 06, 07 |
| Module division | 5 × 36S6P or 12 × 15S6P | open (O6) | Ch 07 |
| BMS | Orion BMS 2, 180 cells (its maximum) | to confirm: settings for the new pack | Ch 06, 10 |
| Pack cooling | Own liquid circuit; requirement h ≥ 0.187 W/K for the average cell (0.26–0.31 counting the hottest-cell spread), design ≈ 0.21–0.44 W/K after the contact-area correction (ch 08) | locked; first module to be measured | Ch 08 |
| Gearing | Overall 2.50: gear pair 48/40 as now, sprockets 16/48 | gear pair locked; sprockets to confirm | Ch 05 |
| Driveline strength | ≥ 843 Nm at the rear wheel, the locked configuration's own figure; allowance to about 1 030 Nm for the 500 Arms development step | open (O20) | Ch 05, 09 |
| Rear tyre | 180/60-17 now; 200/60-17 being studied | open | Ch 09 |
| Centre of gravity | 50 mm lower than Mk3 | locked as a target; height itself open (O17) | Ch 09 |
| Regeneration | 60 Nm at the rear wheel | locked; needs the BMS charge limit raised | Ch 10 |
| HV components | Contactors, fuses, precharge, connectors and DC/DC for 800 V class | open: list with voltage and breaking ratings before ordering | Ch 11 |
| Mass | 253.0 kg baseline, 219.6 kg target, without rider | locked as a target | Ch 09 |
Part II
The powertrain
Motor and inverter are chosen together, and the number that binds them is torque × usable rpm, together with the pack voltage that decides how much of the rpm you actually get, rather than power.
Torque × rpm is the number
A single-speed electric bike is described by one product, not by peak power and peak torque separately.
This chapter settles what a motor is chosen on. On a combustion bike the gearbox decouples engine speed from road speed. An electric bike usually has no gearbox, so the motor's whole operating range has to cover the whole speed range on one ratio. What matters then is the torque you actually have at the rpm you are actually at. Integrated across the range, that collapses to the product of torque and usable rpm.
In plain terms
Torque, power and why they're not the same thing
- Torque (Nm)
- Turning force. It is what accelerates the bike out of a corner.
- Speed (rpm)
- How fast the motor turns.
- Power (kW)
- Torque × speed. Not an independent quantity: it is the product of the other two.
That is why a motor spec sheet quoting only peak power tells you very little. 100 kW can be 500 Nm at 2 000 rpm or 55 Nm at 17 000 rpm, and those are completely different machines to build a bike around: one needs a driveline that survives huge torque, the other needs gearing and bearings that survive huge speed.
The four numbers that decide a motor
| Quantity | What it constrains | Where it usually catches you out |
|---|---|---|
| Kt (Nm/Arms) | Torque per amp → the inverter current you need | Datasheets quote a cold value; flux and therefore Kt fall as the motor heats |
| Kv (rpm/V) | No-load speed at a given voltage → your whole voltage requirement | Gets forgotten until the bike stops accelerating halfway down the straight |
| rpm limit | Top speed and the gearing window | A life statement, not a cliff edge; know what exceeding it trades before you do |
| Ø and mass | Frame architecture and battery packaging | Settled too late, and then the pack doesn't fit |
There's more than one way to reach the same product
Torque × rpm can be arrived at from either end, and the motor's design decides which end you get. A high-speed machine gets there with modest torque and a lot of rpm; a large-diameter, low-speed machine such as the EMRAX gets there with a lot of torque and a modest ceiling. Both ends exist within the same topology: every motor in this chapter's comparison is axial-flux, and they range from 5 500 to 14 000 rpm. Both can produce the same figure, but they hand you completely different downstream problems: gearing, driveline strength, bearing loads, and how much of the corner you can actually use.
Our case the torque outlier CMPWB s15
Ukkonen runs 331 Nm at 5 500 rpm. Ducati's MotoE bike runs 140 Nm at 18 000 rpm; Lightfighter is at 162 Nm, Energica was at 220 Nm. We are the only programme chasing performance from torque rather than rpm, and that follows from the EMRAX's large diameter and low rated speed rather than from its axial-flux layout: the other axial-flux motors later in this chapter reach similar products at 8 000 to 14 000 rpm. It explains why driveline strength is our open item and nobody else's: the same lap time bought with torque loads the chain, sprockets and swingarm pivot far harder than the same lap time bought with rpm. The rotor's large inertia, on the other hand, turned out not to matter much: referred to the rear wheel it costs about 0.08 s a lap compared with the lighter rotor of a high-speed radial motor, and 0.14 s against no rotor at all, which is how chapter 09 counts it.
A datasheet is not a measurement
In plain terms
Torque constant, Kt
What it is. How much torque the motor makes per amp of current you put into it, in Nm per amp. Kt = 0.83 Nm/Arms means 100 amps buys you 83 Nm. It comes from the strength of the field the magnets produce, so it is a property of the motor rather than of how you drive it.
What it affects. Nearly everything downstream. It is the exchange rate between the electrical side and the mechanical side, so it sets how much current you need for the torque you want. Current is what sizes the inverter, the cables, the busbars and the battery's current rating, while current squared is what makes the heat. A Kt that turns out 17 % lower than you assumed means 17 % more current for the same torque, everywhere at once.
Why it drifts. Magnets weaken as they warm up, so Kt at racing temperature is lower than a datasheet value measured cold. You find the real one by spinning the motor and measuring the voltage it generates; the same constant governs both directions, which is what makes this a cheap measurement.
A permanent-magnet machine's torque constant depends on magnet flux, and flux falls with temperature. The datasheet Kt is typically a cold figure. If you tell the inverter the wrong flux, it doesn't just report torque wrongly: it computes the torque command wrongly, so the error is in the control loop, not only in the telemetry.
Our case Mk3 · a fifth too much torque on every screen EMRAXEEPROMCASCWB s9
The EMRAX 268 MV datasheet gives a torque constant of 1.00 Nm/Arms and a magnet flux of 0.06099 Wb. Measured from back-EMF, the flux is 0.0551 Wb at operating temperature (about 4 % under the datasheet once corrected back to 20 °C), and the torque constant that follows is 0.8265 Nm/Arms, 17 % under the datasheet's Kt. The inverter, meanwhile, was running neither figure. It carried the flux value it sets by default for this motor type, 0.066 Wb, higher than even the datasheet's. It computed torque as 1.5 × pole pairs × Φ × Iq, where Iq is the torque-producing part of the motor current, and got 297 Nm where the real figure was 248 Nm. Every torque number seen during the 2024 session was a fifth too high, and the torque command scaled from the same error.
One loose end worth knowing about. The datasheet's own two numbers — Kt = 1.00 and Φ = 0.06099 — do not reproduce each other under the inverter's formula, which gives 0.915 from that flux. Scaling the datasheet Kt by the measured flux ratio instead gives 0.90. So the current range is 0.83 to 0.90, the project uses the lower figure so that its predictions are conservative, and the dyno session is what settles it. The gap is almost certainly a convention difference in how the two documents define current, not a physics disagreement.
The rpm ceiling: an assumption to own
A datasheet's speed limit multiplies straight into the torque × rpm product and therefore into lap time, so it is worth establishing rather than assuming. It is also worth understanding before you go near it, because this is the one place in the chapter where the engineering question and the responsibility question are not the same question.
In plain terms
What a rated limit actually is
A maximum speed on a datasheet is a life statement rather than a cliff edge with failure on the other side: this machine, in this duty, will meet a stated service life at a stated confidence. Several mechanisms sit behind it and they age differently: bearing life falls steeply with speed; rotor hoop stress and magnet retention rise with the square of it; winding insulation ages with temperature and with volts per turn. None of them announces a threshold. They move the machine along a life curve, and the failure, when it arrives, can be sudden.
So the accurate statement is that exceeding a rated limit trades service life and risk for performance, rather than "the limit is conservative, so we can exceed it", and whether that trade is acceptable depends on what the machine is. On a race prototype — inspected between sessions, instrumented, ridden by one professional on a closed circuit, sold to nobody — it can be a defensible decision. On anything carrying a member of the public it is not. And it is the operator's decision to take, on the operator's responsibility: the moment you run outside the rating, the manufacturer's basis for standing behind the part is gone, and reasonably so.
Our case half a second that rests on one assumption EMRAXLOG
The EMRAX datasheet gives 4 500 rpm. Every lap-time prediction in this book is calculated at 5 500, and dropping back to the datasheet figure would cost about half a second a lap, so the whole prediction series rests on that one number.
It is a modelling assumption and should be read as one. The motor has run above its datasheet speed (to 4 530 rpm on Mk3, with its temperatures logged), and the team recalls a dyno run at about 5 500, whose data has not yet been found, so it is treated as unmeasured. The figure is also for Mk4's higher voltage: the dyno has to confirm it before the bike does. Running a motor above its rating is the operator's own decision on a prototype, taken knowingly for one motor in one duty cycle on a race machine that is inspected between sessions; the explainer below says what that decision trades. It is not a general clearance for anyone else's machine. If you need the number for your own motor, ask its manufacturer about your own motor.
The transferable part is a process lesson. Write the assumption into the model with its basis attached, and record its basis in the decision log, so that whoever inherits the simulation can see that half a second of its output is carried by one operating decision that has still to be measured.
Choosing between motors: the tyre decides before the motor does
Comparing candidate motors looks like a torque contest, and for the first part of the range it is. Then it stops being one. Tractive torque at the rear wheel has a ceiling that has nothing to do with the motor: the tyre and the wheelie limit. Past that point extra torque is not slow to arrive or expensive — it is unusable, and a comparison that keeps ranking motors by it is measuring something the bike cannot spend.
So a motor comparison has three questions in it, and they are worth separating because they have different answers:
- Does it reach the tyre? Torque × gearing against the traction limit at your mass. Below the traction limit, more torque turns into lap time; once the tyre is at its limit, extra torque adds nothing.
- How high does it rev? This is the one that survives saturation. Once every candidate saturates the tyre out of slow corners, the only remaining difference is how much of the speed range it covers before it runs out of revs, and that difference only shows up when you have power to spare.
- What does the same lap time cost elsewhere? Mass and grip buy seconds too, usually at a lower price than a motor change, and they do not restart the inverter characterisation.
Our case Mk4 · four motors, one tyre WB s9/s15MAGELECYASA
Four candidates were simulated (two motors from Magelec's racing range, the EMRAX 268 and the YASA P400 R, all four of them axial-flux machines) on the same pack, circuit, power cap and calibration, each on its own optimum gearing. Three results came out of it, and only the first was expected.
Motors that reach the tyre are interchangeable. A wider sweep across four Magelec motors (222, 230, 285 and 291 Nm) returned 1:56.6 for every one of them. Once a motor delivers roughly nine-tenths of what the tyre will take, more torque buys almost nothing: the two Magelecs in the figure sit at 89 % and 100 % of the limit and are 0.02 s apart. The correct instruction is therefore choose the cheapest or the lightest, not the biggest, which is the opposite of how a spec sheet invites you to read the range.
Mass and rpm trade against each other, and the tyre is the referee. The YASA is the heaviest motor in the comparison at 28.2 kg, against the EMRAX's 21.4 on its datasheet (the simulation used 20.5), and its 8 000 rpm sits between the two others: well above the EMRAX, which is rated at 4 500 rpm and simulated at 5 500, and well below the Magelecs' 12 000–14 000. The 7 kg or so costs it about 0.2 s, and the rpm is what pays it back: 8 000 rpm is just enough for a ratio that saturates the tyre (1 164 Nm at the wheel, exactly the limit at its mass) without giving up top speed, where the EMRAX's 5 500 is not, and it gets there on the 400 Arms the planned inverter already provides. It lands 0.48 s ahead of the EMRAX and within a tenth of the Magelecs, and the datasheet's full 370 Nm at 450 Arms gives the same lap time, because the extra torque is above the tyre. A third independent axial-flux machine arriving at the same half second confirms the comparison rather than questioning it.
A smaller EMRAX is not a shortcut. The EMRAX 228 is about 8 kg lighter than the 268 (13.5 kg against 21.4 on the two datasheets) and is rated 2 000 rpm higher (6 500 against 4 500 rpm); simulated at 6 500 against the 268's 5 500, it revs 1 000 rpm higher, and on the same simulation it is 1.48 s slower. The extra 1 000 rpm does not make up for 111 Nm less torque: at its best ratio it reaches only 65 % of the tyre's limit out of a corner, and its top speed stops at 241 km/h. Its datasheet figures are, if anything, optimistic for it: if the same in-service flux loss measured on the 268 applies, it gets slower still. It would need about 8 000 rpm to match the 268 and about 9 500 to match the YASA EMRAX 228.
Bus voltage is not itself worth lap time. The 800 V-class Magelec on 648 V gives 1:56.65; the 400 V-class one on 389 V gives 1:56.67. They are 0.02 s apart, from the same 1 080 cells rewired from 180S6P to 108S10P. Same energy, same per-cell current, same heat. What changes is pack current, which rises by two-thirds (180/108 = 1.67), and that is a busbar and connector problem rather than a lap-time one. Voltage is worth lap time only when it stops a motor being voltage-limited, which is what chapter 06 is about; it is not worth anything on its own.
The gap that decides is the rpm ceiling, and it is invisible at race power. At the 135 kW race cap our EMRAX loses 0.55 s to the Magelec; with the full development list (lower mass, more grip) that shrinks to 0.4 s, because mass and grip pull the heavier, lower-revving motor back towards the tyre limit. But at the 180 kW qualifying setting the gap opens to 1.6 s, because EMRAX simply cannot use the extra power: 5 500 rpm arrives first. That is the one number in the whole comparison that cannot be bought back anywhere else.
The decision was to keep the EMRAX and not close the door. It is bought, characterised and in the workshop; its deficit over a race is worth less than the mass and grip work that is queued anyway; and a motor change would restart the inverter characterisation. If the goal ever narrows from a ten-lap race to a single fastest lap, the answer changes, and the analysis says so explicitly rather than leaving the reader to infer it.
What this comparison is not
The Magelec and YASA figures are a paper comparison and the document says so: Kt is derived from the datasheet's peak torque and peak current rather than measured (only the EMRAX 268's has been measured), the YASA's 160 kW is not usable under the 135 kW pack cap, every Magelec option needs a two-stage reduction whose added mass and loss are not in the simulation (and at roughly 0.2 s per efficiency point that is not negligible), and price and lead time are unknown. A comparison that states its own gaps is usable; one that doesn't is not.
The numbers a datasheet does not print
The second lesson from the same exercise is about elimination. A motor is rarely separated from its rivals by its headline figures. It is separated by a number the datasheet does not print in a usable form: the torque constant at the current you will actually run, whether the speed limit is a hard ceiling or a life rating, what the insulation system is qualified for. The way to get that number is to ask. Write to the supplier with short, specific questions; manufacturers generally answer clearly and quickly, and they are the only source of reliable information about their own product.
Three habits make the answers worth more. Ask the disqualifying questions before the interesting ones, because one figure can settle a selection before a long letter is ever needed. File the answer in the project's decision log, not in somebody's inbox, and respect it if it was given in confidence: an answer written for your project is not yours to publish. And treat it as the manufacturer's statement, not a measurement. This chapter opens by saying that a datasheet is not a measurement, and an email is not one either; if a candidate is close enough to matter, bench it before the choice is final.
The right answer is a winding you specify — and most projects can't have it
Everything above treats the motor as something you pick off a shelf, but a motor can also be wound to order. A permanent-magnet machine's Kv is set by turns per coil, and the insulation system may be the same across a manufacturer's low-, medium- and high-voltage variants, with only the turn count and wire gauge changing. Whether that is so for a given motor is a question only its manufacturer can answer, and it cannot be assumed. In principle, then, the correct move is not to pick the winding closest to your bus but to have the winding wound for your bus, so the motor reaches its rpm ceiling exactly where your pack runs out of volts and no current is wasted on field weakening — the trick, explained in chapter 06, by which an inverter buys rpm above the pack’s natural limit at the cost of current that makes no torque.
In practice this is available to very few projects, and it is worth saying why:
- Somebody has to agree to wind it. That means a manufacturer with the appetite for a one-off, which in practice means a commercial or sponsorship relationship rather than a purchase order.
- You inherit the qualification question. A non-standard winding on a higher bus raises volts-per-turn, and turn-to-turn insulation is what that stresses. The failure mode is slow partial-discharge erosion, so it shows up mid-season rather than on a test bench, which means it cannot be dismissed by "it ran fine on the dyno".
- It restarts the inverter work. A stock motor that your inverter already has a parameter set for is worth real weeks.
- Lead time and one-off price are both unknown until you ask, and both land on the critical path.
So the practical order is: take the standard winding that best matches the bus you can build, and treat a custom winding as a question you ask early, because the answer, whichever way it goes, changes the pack.
Our case a custom winding the project turned out not to need LOG 9 Sep 2026
While the pack was moving to 180S, the project looked at exactly this route: a motor's lower-voltage winding, whose Kv suited the new bus, built with the insulation of a higher-voltage variant. The question is an insulation question rather than a winding-design one, and it is the kind a manufacturer has to answer for its own product.
The arithmetic behind the worry is worth keeping, because it is the same on any machine. Volts-per-turn scale with bus voltage, so a winding rated for 550 V and run on a 760 V bus sees about 1.38× the turn-to-turn stress it was rated for. Motor insulation for inverter duty is qualified with a margin for exactly this: IEC 60034-18-41 multiplies the operating voltage stress by an enhancement factor when it sets the test voltage for Type I insulation (the insulation class meant to stay free of partial discharge in service), and the standard's worked examples use 1.25 IEC 60034-18-41. A 1.38× overstress is larger than that example margin, so whether a given winding tolerates it is a question for the manufacturer's qualification data, not for arithmetic; either way it spends the margin rather than operating within it.
In the end the project didn't need a custom winding, because it kept the motor it already had: the EMRAX 268 MV is already an 830 V motor on its datasheet EMRAX, so 180S is the voltage it was designed for rather than an overrun. That is the cheapest version of the same answer: a stock winding that happens to match the bus you wanted anyway, and the one to look for before asking anyone to wind something.
Gearing: the optimum is flat
Optimising the ratio on a single-speed machine usually returns very little. Sweeping overall ratio across a sensible window moves lap time by hundredths, because shorter gearing buys acceleration and gives back top speed in almost equal measure. That is good news: you get to choose the ratio on mechanical grounds (chain tension, chain speed, sprocket diameter, what you can actually make) because the calculation isn't imposing a tight requirement. What the calculation does care about is efficiency: on a comparable bike two percent of driveline loss is worth about 0.4 s a lap, more than the whole gearbox weighs in lap time. WB s15
Our case three sprockets, one lap time WB s0-AHB 20
The three candidates 16/48, 15/45 and 17/51 land within 0.01 s of each other. So the choice is mechanical: 16/48 gives 6 771 N chain tension and 27.9 m/s chain speed; 15/45 is the smallest change (rear sprocket only, currently 42T) but takes tension up to 7 216 N. One constraint is still analytical: the rolling circumference has to be measured, because the whole ratio is derived from it, and when the tyre size changed the measured figure got replaced by a derived estimate.
Rule
Measure the torque constant at operating temperature before you trust any torque number.
It is one dyno run, and it fixes the telemetry, the torque control and every acceleration figure in the simulation at the same time.
And when comparing motors, compare torque only up to the tyre's limit and rpm all the way. Above the tyre, torque is decoration; the rpm ceiling is the one difference that cannot be bought back from mass, grip or gearing.
Voltage is a system-level choice
Pack voltage is less a battery parameter than the performance ceiling for the whole machine, and it is the one most people learn about on track.
This chapter settles the series count, which is the same thing as settling the voltage. Back-EMF in a permanent-magnet machine rises with speed. When it reaches the available pack voltage, the inverter can no longer push current into the windings normally. That point is the base speed:
In plain terms
Back-EMF, Kv, base speed and field weakening
These four go together, and this is the chain that catches most people out.
- Back-EMF
- A spinning motor is also a generator. It produces a voltage that opposes the supply, and that voltage grows with speed.
- Kv
- The speed constant, in rpm per volt. It tells you how fast the motor would spin, with nothing attached, at a given voltage. Kv = 9.39 on a 400 V pack gives 3 756 rpm with no load at all, and under load you cannot reach it without field weakening.
- Base speed
- The speed at which back-EMF has grown to meet the supply voltage. Below it you can have full torque. Above it you can't push current in the normal way any more.
- Field weakening
- A trick that gets you past base speed: the inverter injects current that partly cancels the magnets' field, lowering the back-EMF. It works — but that current makes no torque.
What it affects. Together these set the top of your usable rev range, and therefore half of the torque × rpm product from chapter 05. Field weakening is the part worth understanding, because it is a tax: you are spending current, heat and inverter capacity to buy rpm that more voltage would have given you for free.
Above base speed the inverter can keep going with field weakening: it injects negative d-axis current that opposes the magnet flux and lets the machine turn faster. It works, and the price is direct — d-axis current produces no torque. It heats the winding and the inverter, and it eats part of a current budget that would otherwise have been pulling you forward.
So the voltage is chosen for the motor, or the motor is wound for the voltage. What decides is where the motor's base speed lands against the rpm the gearing needs at top speed, and that is set by Kv and pack voltage together. A motor with a low Kv needs a high voltage, which is Mk4's case below; if the voltage is fixed by other constraints, the motor has to be wound to suit it (chapter 05, last section). The voltage class on its own buys little. An 800 V system can in principle be faster, because the same power at half the current lets cables, busbars, connectors and fuses be lighter, but against a well-matched 400 V system the project's estimate is that the difference is small TEAM. The project's own simulation points the same way without isolating it: two Magelec variants, one per voltage class, on the same cells rewired from 180S6P to 108S10P, differed by 0.02 s (chapter 05), a comparison that changes the motor as well as the voltage. Lightfighter's current V3, one of the fastest electric race motorcycles in the field of chapter 01, runs a 400 V-class pack: 383 V nominal, 440 V peak RIDEAPART.
Our case Mk3 · why 232 km/h was the ceiling AiMWB s9LOG 9 Sep 2026
Mk3 topped out at 232 km/h, measured by GPS on 9 August 2024 with the motor at 4 530 rpm, which on its gearing is 233 km/h at the wheel, and for a long time the assumption was that the cause was power, or the inverter. The data said otherwise. At top speed the log shows Id = −259 A and Iq = 174 A: only 56 % of the current was making torque, the rest was field weakening. 400 V × Kv 9.39 = 3 756 rpm is the motor's no-load speed at that voltage; the inverter stretched it to 4 530 with field weakening. The same arithmetic also explains why an earlier inverter stopped at 3 700 rpm back in 2022 — the inverter was never the problem, on either occasion. Mk3's ceiling was voltage, not power and not the motor. That one finding is the entire argument for going to 180 cells in series.
Three ceilings decide the series count
Series count is set by the lowest of three independent ceilings:
- The inverter's voltage window. The upper bound is usually the trip voltage rather than the nominal maximum, and a fully charged pack sits well above nominal. You need the lower bound too: an empty pack under load must not drop out of the window.
- The BMS cell count. Surprisingly often this is the binding one, and it is completely hard — a BMS has a fixed maximum, and frequently a connector-group structure that favours certain multiples.
- Insulation. Motor winding class, connectors, cables and measurement circuits.
Check rather than assume on the third one. Motor insulation may be specified the same way across a manufacturer's range regardless of winding voltage, in which case it isn't the constraint at all; ask the manufacturer, because it varies.
Our case Mk4 · which of the three ceilings actually set 180S CASCORIONEMRAX
Inverter: the CM200DZ planned for Mk4 accepts 200–840 VDC and trips at 860 V. BMS: 180 cells is an absolute maximum, and 36S lands cleanly on its 12-cell connector groups. Motor: the EMRAX 268 MV is rated for 830 VDC on its own datasheet, so at 756 V full it runs inside its rating; insulation was never the ceiling, and a partial-discharge measurement wasn't needed as a condition of the decision. The lowest ceiling was the BMS. Full 756 V, nominal 648 V, empty 450 V — inside the inverter window from both ends.
Two of those three ceilings are only ceilings because you bought them
Worth saying plainly, because the table above reads as physics and only one row of it is. The inverter's voltage window and the BMS's cell count are product limits, not natural ones. Design your own battery management electronics and the 180-cell maximum disappears, along with the constraint it puts on module size and series count — exactly as a motor wound to your own specification removes the Kv constraint in chapter 05. Both routes are available, and both have a cost.
What they cost is not money, it is what the project becomes. A team that designs its own BMS is a team doing BMS development, with its own validation, its own failure modes and its own share of the season; the same is true of winding a motor. That may be the right choice; for a research group it can be the whole point. But it has to be chosen rather than drifted into, and the question to ask out loud is the one this book keeps returning to: does this work produce lap time, and is it the cheapest second available? For this project the answer was no on both counts, so the ceilings stayed where the catalogue put them.
One consequence is worth keeping even if you never build your own: which supplier's limit binds is a purchasing decision and can be revisited. Ours happens to be an Orion, and if a better or more workable unit appears the ceiling moves with it. A ceiling with a part number in it is negotiable in a way that Kv × U is not.
One consequence of the series count: the 12 V supply
The series count also decides the low-voltage side. The 12 V supply looks like a catalogue item and usually isn't: a traction pack swings widely between empty and full, and a fixed-ratio converter alone can't hold a regulated low-voltage output across that range. The usual answer is two stages (an isolating fixed-ratio stage from HV down to a safe level, then a regulating stage), and the selection criterion on a race bike is mass, where the difference between module types is not marginal.
Our case Mk4 · the 12 V converter LOG 16 Sep 2026
The pack runs 450…756 V, a ratio of 1.7:1, so a fixed-ratio converter on its own won't give a regulated 12 V. The architecture chosen is a two-stage one. The deciding criterion was mass: the isolating module weighs 68 g, where an automotive-grade 800 V DC/DC unit weighs kilograms. Part number still open.
The same ceiling, three bikes and two inverters apart
A diagnosis is much stronger when the same mechanism shows up on hardware that shares almost nothing. This one does: only the motor is the same, and its Kv is the point. It was in the project's logs from the first season.
Our case Mk1 · the answer, logged in 2022 HIST
Mk1 ran a 96S Samsung pack and a Sevcon Gen5 S9, a different chemistry, a different cell count and a different manufacturer's inverter from the bike that produced the diagnosis in this chapter. Its logs say the same thing, and the clearest run is a straight line on a closed airfield in September 2022, where cornering is not a variable at all:
| What the log shows | Value | What it means |
|---|---|---|
| Highest speed reached | 240.4 km/h | Airfield, and the fastest any version of this bike has run |
| Motor speed there | 3 648 rpm | Against a no-load ceiling of about 3 030 rpm at that pack voltage, 20 % beyond it |
| Pack voltage there | 323 V | From 392 V full |
| d-axis current there | −200 A | Current spent on field weakening rather than on torque |
| Voltage modulation there | 93.8 % | How much of the available pack voltage the inverter was already using. At 100 % there is nothing left |
| Where pack power reached its plateau | 2 200–2 600 rpm | Base speed, at 140–165 km/h. From there to 3 500 rpm the pack delivered a flat 93–101 kW while torque fell: the constant-power region, seen from the battery side |
Read the d-axis and modulation rows together. The bike's best speed was set with the inverter at 94 % modulation and more current going into holding the voltage down than into making torque. It was not accelerating towards a higher speed and running out of road; it had run out of volts. On the circuit the same signature appears lower down — above base speed the current goes almost entirely to the d axis, the q-axis current wanders, and the bike stops pulling.
That is Mk3's 232 km/h ceiling of two generations later, found in 2022 with a different pack, different cells and a different inverter around the same motor. Kv × U does not care whose badge is on the inverter.
Our case the bike that beat us had already made this decision RACE22TWENTE
At Imatranajo in July 2022, Mk1 raced a Dutch university team's machine and lost. Their bike ran a claimed 800 V against Mk1's 355 V nominal, on almost exactly the same stored energy (13.5 kWh against 13 kWh) and about 40 kg less mass. Their figures are the team's own and should be read as claims rather than measurements, but the voltage is the part that shows in the result.
The decision Mk4 is making in 2026 had therefore already been made, by a comparable student team, before Mk1 first turned a wheel in anger. The cost of not reading the field is visible in a result sheet, and it is the same cost the chapter's rule is trying to prevent.
The team knew this from 2022 onwards, which raises the more useful question of why it took four years. Not because the diagnosis was missing; it was in the logs from the first race season, and the competitor had demonstrated the answer in the same paddock. Because pack voltage is not a pack decision. Going from a 400 V class to an 800 V one changes the inverter, the BMS, the contactors, the fuse, the charger, the DC–DC converter, the insulation monitoring, the connectors and the cable, and each of those is a procurement with a lead time attached. It is the most expensive kind of change a project can face: cheap in principle, and only available at a generation boundary. Funding varied from year to year, and in several of those years it simply was not possible to buy the list. That is the real reason a known fault survives for four years, and it is worth naming, because a reader who assumes the team just hadn't worked it out will draw the wrong lesson. The lesson is chapter 04's: get the voltage right at the start, because after that it is not one decision, it is nine.
The comparison closed two generations later, and it is worth saying so plainly because the rest of this chapter is an argument about what the project got wrong: at KymiRing in 2024 Mk3 was the quicker bike by a wide margin, as chapter 01 sets out LUTTWENTE. It won on cornering, packaging and mass, with the voltage question still unresolved: Mk3 gave away power to a machine that had already made the decision, and still finished the day fourteen seconds a lap ahead, on the only times the two bikes set together.
That is the second half of the lesson, and it weighs as much as the first. When the fix is known and cannot be funded yet, get everything else out of the machine you have. A first estimate that turns out wrong on a prototype does not cost a season if the rest of the bike keeps improving around it: Mk3's cornering, packaging, mass and setup were all worked on while the voltage waited. So the lesson of these four years is two sentences, not one. Fund the fix as soon as it can be funded, and until then optimise around it. The result was a reprieve rather than a verdict, which is why this chapter exists at all.
Rule
Work out Kv × U before you pick a pack voltage, and compare it to the rpm you actually want to use.
If the product falls short, the bike spends the straight in field weakening throwing away part of its current. It is one multiplication, and skipping it cost Ukkonen two generations.
Part III
The battery
Once voltage is fixed, the pack is sized by three things (energy, current and heat), and on a race bike heat is the one that binds. It is also where the kilograms are.
Energy storage: cell count decides the heat
The series/parallel split doesn't change per-cell current for a given cell count. That is the most common misconception in pack sizing.
This chapter settles the cell count. Once the series count is locked, sizing the pack is the intersection of three requirements: energy (how far), current (how hard) and heat (how long). On a race bike the third is usually the binding one, even though the first two are the ones you calculate first.
In plain terms
Reading a pack configuration: 180S6P
Cells wired in series (S) add their voltages together. Cells wired in parallel (P) add their capacity and their current capability, at the same voltage.
So 180S6P means: take 6 cells in parallel to make one group, then wire 180 of those groups in series. That is 180 × 6 = 1 080 cells. The pack's voltage comes from the 180; the current each individual cell has to carry comes from the 6.
- Ah (amp-hours)
- How much charge a cell holds. A 5 Ah cell can in principle give 5 A for an hour, or 50 A for six minutes.
- kWh
- Energy — roughly volts × amp-hours ÷ 1000. This is what decides how many laps you get.
- C-rate
- Current expressed as a multiple of the cell's capacity, so cells of different sizes can be compared fairly. A 5 Ah cell at 8C is drawing 40 A.
- SOC
- State of charge, 0–100 %. It doesn't track voltage linearly, and the window you can actually use is never the full range.
Energy budget
Energy comes from per-lap consumption: kWh per lap × number of laps, minus whatever regeneration gives back. You can get per-lap consumption from the lap simulation or straight out of measured ride data, and the second is better.
Leave margin at the bottom. A pack that is emptying sags under load, and if it sags below the inverter's lower limit or the BMS undervoltage cut, the session ends before the energy does.
Per-cell current doesn't depend on the S/P split
This is worth deriving once yourself, because the result is counter-intuitive. For a given power and a given number of cells, per-cell current is the same regardless of how you split them into series and parallel. A higher series count raises voltage and lowers total current, but it removes parallel branches in exactly the same proportion. Net result: per-cell load, and therefore I²R loss per cell, is set by the cell count — not by the split.
Two things follow. A freedom: choose the S/P split on voltage and BMS grounds, because it doesn't cost you heat. And a hard constraint: if the heat doesn't fit the budget, the only fix on the battery side is more cells. Rearranging them won't do it.
Our case Mk4 · 1 080 cells, and why not 900 WB s0-A/s3LOADMOLI
The Mk4 pack is 180S6P: 1 080 Molicel INR-21700-P50B cells (5.0 Ah, 60 A continuous rating, 70 g each), 19.4 kWh, about 102 kg. Peak per-cell current, at the full 135 kW, is 40 A (against about 21 A RMS averaged over a lap, which is the figure that sets the heat in chapter 08), the same as the previously calculated 104S10P, because the cell count is essentially the same. The energy budget is tight: 1.82 kWh per lap × 10 = 18.2 kWh, which recovering 15 % of the braking energy (about 1.4 kWh over the ten laps) brings to 16.8 kWh, leaving 14 % SOC at the flag. There is no room in that for regeneration not working. The ten laps, the 135 kW cap and the 15 % recovery are design requirements rather than results; chapter 04 lists where each comes from and what changing it would cost.
The tempting fallback was to use only the 900 cells already purchased, as 150S6P. Same power from fewer cells means per-cell current rises in proportion (1 080/900, or 1.2×) and heat rises with the square: 1.44× the thermal load, roughly 48 A per cell at peak instead of 40. A ten-lap race stops being possible: the same arithmetic as above, run in the other direction.
Cylindrical or pouch
Several of the machines this book compares itself against run pouch cells (the Dutch team's 2022 Delta-XE MOTORRAD and Lightfighter FARASIS among them), while Ducati's MotoE bike, like Ukkonen, uses cylindrical 21700s; Ukkonen has run cylindrical 18650 and then 21700 cells through its three built generations, and Mk4 is designed on 21700s. The reasons were practical, not electrochemical. Availability: automotive-grade pouch cells were hard for a small team to buy at all, and hard to buy in small numbers; 21700 cells of known type were on a web shop with a delivery time of days. Fit: the standard pouch formats on offer did not fit the frame's dimensions, whereas a pack built from cylindrical cells can be shaped, in steps of one cell, around whatever volume the chassis leaves. Neither reason is a verdict on the chemistry. They are a verdict on the project's purchasing position, and a team with an automotive supplier should re-run the comparison.
The trade itself, in outline. Pouch: higher energy and power density at the cell level, a large flat face that suits plate cooling, and tabs that carry high current without welding many small joints; against that, the need for compression fixtures and a rigid enclosure, swelling over life, a vent that is not a defined feature, and a format that dictates the pack's shape. Cylindrical: a steel can that is its own structure and its own vent, a format that can be shaped around the bike and bought in any quantity, and a failure that tends to stay in one can; against that, a lower packing density, thousands of welded joints (the interconnect problem later in this chapter), and a heat path that has to leave through the can's ends or its curved side rather than a flat face. On this project the joint count and the heat path are the two costs that have been paid for choosing cylindrical, and both are visible in this chapter and the next.
Power cell or energy cell
Before the cell choice, one framing from outside the project, because it is easy to get backwards. Capping power costs very little lap time on a grip-limited circuit, and people who have raced these machines for a long time treat that as the design margin rather than as a compromise. The outside reviewer of chapter 12 made the same point: it is better to have more power on tap than you need and turn it down than to chase every last bit out of a powertrain that has just enough; and, concretely, some Isle of Man machines ran a peak of around 80 kW purely so the riders would reach the end REVIEW22. Size the powertrain for headroom and the battery for the distance; the cap is a setting.
Cylindrical cells split roughly into power and energy types. A power cell gives a higher continuous C-rate and lower internal resistance but fewer watt-hours; an energy cell the reverse. On a race bike the choice usually falls out of the energy budget: if ten laps don't fit, a power cell doesn't help, because the pack is empty before its current capability ever becomes the limit.
Three numbers are worth measuring rather than reading off a datasheet: internal resistance at operating temperature rather than room temperature, capacity at the real discharge current, and the cell's actual outside diameter. The last one sounds trivial. It is the start of the dimension chain.
Classic mistake
A cell format name is not a cell dimension. “21700” means a nominal 21.0 mm diameter, but the real cell can be 21.55 mm, and more with the sleeve. Ukkonen's cooling channel was first dimensioned from Ø21.0, and correcting it moved the arc radius, the row pitch and the channel width, every one of them a tooling dimension. The same check then found a larger error in the same drawing: the channel's outline, 132 × 70 mm, had no room for the bond flange, the manifolds or the run-out of the corrugation. Drawn properly it is 171 × 96 mm, the contact field is 58 mm tall rather than the cell's 70, and the contact area is 17 % smaller, which moves the whole thermal estimate about 15 % the wrong way (chapter 08). Neither was a calculation error; both were dimensions nobody had drawn. A third diameter, 21.22 mm, was later measured on the same cells by a thesis student, so the diameter is still not settled. CC §07TIT
Joints: nickel for weldability, copper for conductivity
Cells are normally joined by spot-welding nickel strip to the terminal. Nickel welds well and conducts badly: hot, its resistivity is roughly four times copper's. In a high-current pack, nickel alone won't do as a collector or as a series link.
The division of labour that works is nickel from cell terminal to collector (low current, weldable, and the strip's cross-section can be sized so it also acts as the per-cell fuse) and copper as the collector and series link, where the current actually is. The nickel strip is soldered onto the copper; it adds a few percent to conductivity, so it isn't a conductor, it is a joining surface.
Which welding process to use is a separate question with a good published answer: ultrasonic, laser, micro-TIG, resistance and mechanical joints have been compared with manufacturing-readiness ratings and separate decision matrices for cylindrical, pouch and prismatic cells DAS. Worked pack designs from student and record projects are worth reading alongside it, less for their numbers than for the checklist of what a pack design has to demonstrate PACKS.
Why not aluminium
On the properties you can look up, aluminium is the obvious answer and it isn't close. Per kilogram it conducts about twice as well as copper and seven times as well as nickel, and mass is the thing this whole book is trying to remove. A selection table built from resistivity and density will choose aluminium every time, and the table will be arithmetically correct.
It is still the wrong answer, because the decisive property isn't in the table. A cylindrical cell's can is typically nickel-plated steel, so a busbar-to-can weld is not an aluminium joint: it is a dissimilar joint involving aluminium, nickel and steel. Aluminium to steel is the hard pair. A fusion weld between them forms Al–Fe intermetallic compounds at the interface, among them Fe2Al5 and Fe4Al13 (also written FeAl3). These aluminium-rich phases are hard and brittle, and a thicker layer generally means a weaker joint ASIRVBEYGI. Fe2Al5 is reported as the thermodynamically stable phase; which phase forms first depends on the thermal and compositional conditions, and the literature reports both orders ZHANGBEYGI. The layer limit usually quoted is about ten micrometres, and it is a rule of thumb rather than a universal limit: the optimised busbar welds in one study held 5–20 µm, and 5–10 µm over part of the interface ASIRVZHANG.
Copper to steel avoids that reaction system: copper and iron form no harmful intermetallics ASIRV, although the pair has difficulties of its own: copper and iron have limited mutual solubility, and laser-welded steel–copper joints segregate and are prone to solidification cracking CUFE. Nickel is the compatible metal: it is soluble in both iron and copper, which is why it is the usual intermediate layer when copper is welded to steel TMAT.
Nickel-plated aluminium busbars are used in battery interconnects, and the plating changes how they weld. One study laser-welded nickel-plated 1 mm aluminium sheet onto unplated aluminium sheet, an aluminium-to-aluminium joint rather than one to a steel can. The lap-shear strength was 840 N without plating, about 1.1–1.2 kN with the thinnest plating (3–4 µm) and about 1.6 kN with 15 µm, while thicker plating generally raised weld porosity. For that sheet the authors recommend sulfamate nickel under about 4 µm as the compromise between strength, porosity and conductivity NIPLATE. The study does not test a joint to a cell can, so it says nothing directly about the aluminium-to-steel problem above. What it does show is that where aluminium busbars are used, the nickel has not gone away: it has moved to a plating line.
In plain terms
What an intermetallic is, and why a weld cares
When two metals dissolve into each other freely (nickel and iron, copper and nickel), the solidified weld is a solid solution: one metal's atoms sit in the other's lattice, and the result behaves like a metal, bending before it breaks.
Some pairs won't do that. Instead they form intermetallic compounds: new substances with their own fixed recipe and their own crystal structure, such as Fe2Al5. They are hard, brittle and relatively poor conductors, and they grow as a layer right in the joint. A thin layer is survivable. A thick one is a ceramic wafer glued between your busbar and your cell.
This is why "is it weldable?" is not a question about one material. Weldability is a property of the pair, and of the process. Both metals in the table can be welded; the pair is the hard part.
Our case the selection table that was right and wrong at the same time HUSUASIRV
The 2025 cooling thesis chose the cell-to-cell busbar material from a three-column table: resistivity, density, and a yes/no column headed weldable. Copper, nickel and aluminium all scored "yes". Aluminium won on the two numeric columns and was selected: 0.5 mm 1060-O, pressed to shape in 3D-printed dies.
Not one of those busbars was ever welded to a cell. The yes/no column had collapsed the only property that decided the outcome, and it had collapsed it to the wrong answer: each metal is weldable, the aluminium-to-plated-steel pair is the difficult one, and the process tried was laser welding, which handles that dissimilar pair badly, and the project's own resistance spot welder, used for nickel strip, will not reliably join it at all.
The lesson is not that the engineer picked badly. The numbers were right, the sources were right, and the weighting was documented. A selection table can only decide what its columns can see — and the columns that are easy to fill are the ones any database will hand you, while the one that decides is a property of a pair, a process and a geometry, which no database holds.
Our case Mk4 · what nickel alone would cost HB 30DAS
Current in a 6P group and its series link is 126 Arms at race pace, 242 A at peak. Over a 30 mm link, 2 × 20 mm copper (40 mm²) gives 15 µΩ and 0.24 W; 0.3 × 20 mm nickel (6 mm²) gives 433 µΩ and 6.9 W. Across the whole pack that is 43 W against 1 240 W, and additional sag at peak current of 0.6 V against 18.9 V.
Two consequences. Nickel alone would add over a kilowatt of heat at the cell terminals, which the cooling channel doesn't cool. And 19 V of extra sag would eat into exactly what the 180S decision had just bought. The fuse should be the nickel strip, not the busbar.
How much copper, though, is a separate question from whether copper. 2 × 20 mm is comfortable and weighs about 8.8 kg across the pack; 1 × 25 mm carries 5.0 A/mm² at race RMS (the upper end of ordinary busbar practice rather than past it), heats about 16 K on a 30-second peak, and weighs 5.5 kg. The current direction is the thinner one, parked until CAD because busbar thickness is part of the same dimension chain as the cell holder. Thinner copper also solders far more easily, and across 2 160 joints that matters more than the 3.3 kg.
Rule
If the heat doesn't fit, add cells. Rearranging the S/P split is not a fix.
And in reverse: once the cell count is decided, the heat load is decided. Cooling design starts from that number and not before.
And for any joint: before comparing materials, write down the other side of the joint and the process you actually own. Weldability is a property of the pair, not of the metal.
Heat is what ends the session
On a race bike you rarely run out of energy. You run out of heat capacity, and you run out of it mid-session. It is also where Ukkonen lost the most.
This chapter settles the cooling requirement and how to meet it. A typical electric race session ends with a power limit rather than an empty battery: the BMS or the inverter sees an over-temperature and pulls the current limit down, and the bike slows progressively. To the rider it feels like the bike dying. In reality there is plenty of energy left.
Our case Mk3 · nine minutes, 58 % charge left AiMO2BMSLOAD
KymiRing, 9 August 2024. More than half the charge was still in the pack. What ran out was heat capacity: the air-cooled 104S6P pack warmed up, and the BMS temperature derate took the current limit to under a third, and the power to under a quarter, in nine minutes. The per-cell load that did it was 24 A RMS, and the bench had already shown what that does. The project's load tests used 24-cell test modules (6S4P, four cells in parallel) discharged at 21 A per cell until the hottest cell reached the 52 °C cut-off LOADWB s3-B/K:
| Cooling on the bench | Cells | Time to 52 °C |
|---|---|---|
| None | P42A | 300 s |
| None | P50B | 375 s |
| Air: a fan across the sides | P42A | 320 s |
| Air: a cordless blower across the sides | P42A | 491 s |
| Water on the sides: printed heat-conducting webs between the cells, carrying heat to water-cooled aluminium plates | P42A | 308 s |
| Water on the cell ends: water-cooled plates against the cells' flat ends | P42A | 400 s |
| Water on the ends and a fan across the sides | P42A | 410 s |
| Water on the ends and air across the sides | P50B | 490 s |
Five to six minutes uncooled, and about eight at best, with a blower or with water on the ends and air across the sides. None of those set-ups was sized for this load: the water came straight from the building's supply at a temperature nobody logged, and at this current they carried away roughly 0.05–0.09 W/K per cell, two to four times less than the Mk4 pack needs WB s3-B. The bench's best figure, 0.172 W/K with water-cooled plates and printed webs between the cells, came from a short test at 42 A with the water temperature assumed, and the arrangement would have weighed 17 kg on the pack WB s0-A/s3-K; it shows the physics works, not that a design does. They bought minutes, not laps. Nine minutes on track was the same result at full scale.
That one measurement changed the design principle for the next generation: Mk4's battery design starts from removing the heat, not from adding capacity.
The project's first race tells the same story at a higher price, and it is told later in this chapter, after the method, where it is easier to read, because its whole point is a temperature limit that nobody had decided.
The requirement is derived from a temperature limit, not chosen
The cooling requirement falls straight out of three numbers: cell dissipation at race load, the cell's maximum allowable temperature, and the coolant temperature. The rest is division.
In plain terms
Where a battery's heat comes from, and how it's counted
- I²R
- Current squared times resistance: the heat any conductor makes when current flows through it. A cell has internal resistance, so it heats itself from the inside. Double the current, four times the heat. That is why current is the dominant term in every battery thermal problem.
- RMS current
- The steady current that would produce the same heating as the real, constantly varying current. A lap of hard acceleration and coasting has a much lower RMS than its peak. Use RMS for heat, peak for mechanical and electrical stress; mixing them up will give you a pack two sizes too big or a fuse that blows.
- Thermal resistance, K/W
- How many degrees of temperature difference it takes to push one watt through something. Low is good, and values add up in series exactly like electrical resistance.
- h, in W/K per cell
- The inverse, and the way this handbook states the cooling requirement: how many watts you can carry away per degree of difference between the cell and the coolant. 0.187 W/K means every degree of difference removes 0.187 W.
Why it's stated as h. One number holds the whole cooling requirement. Multiply it by the temperature difference you are allowed and you get the heat you can remove. If that is less than the cell produces, the pack heats up until something intervenes — which is what a session ending early actually is.
Dissipation comes from per-cell current and measured internal resistance: P = I²R. Do it with the RMS current across the whole lap, not peak current: the peak lasts seconds, and thermal equilibrium settles in minutes.
Our case Mk4 · deriving 0.187 W/K CC §09LOAD
A P50B cell at 21 A RMS and a measured 12.5 mΩ dissipates 5.62 W at race pace. The manufacturer's discharge range ends at 60 °C, and the coolant is taken to be at most 30 °C. So h ≥ 5.62 / (60 − 30) = 0.187 W/K per cell. The workbook carries 0.11, which is the same question asked differently: it comes from a transient ten-lap model and a 70 °C cell; the same model gives 0.168 for 60 °C WB s3-I. An older 0.03 belonged to the previous pack. Write the requirement as a formula rather than a number and it updates itself when the temperature limit or the coolant changes.
The 30 °C is an assumption, and it has a weather forecast behind it. A radiator cannot cool the liquid below the air. The cooling-channel document sizes the radiator for air at 25 °C and coolant at 35 °C, which for the pack's 6 kW needs UA ≈ 607 W/K; with the coolant entering the pack at 30 °C and warming about 8 K through it, 35 °C is roughly the loop's average CC §08. 25 °C is above the project's own estimate of about 22 °C for a daytime race in a Finnish summer, where the July mean is 16–18 °C in the south and centre of the country (1991–2020) FMI, so the design point has a few degrees in hand. It does not cover a hot day. The 2022 race in this chapter was run above 30 °C, and at 35 °C coolant the requirement is 5.62 / 25 = 0.225 W/K, 20 % more; at 40 °C it is 0.281, 50 % more. The same document notes that letting the coolant run to 40 °C would shrink the radiator to 405 W/K; against a 60 °C cell limit that is a trade to decide, not a free saving. The radiator and the design point are untested and stay open as O21.
One term is deliberately left out of that number, and it is worth saying so rather than letting a reader wonder. Regeneration adds heat — it can never subtract it, because ohmic loss does not care which way the current flows. On this pack it comes to one or two percent of the lap's cell heat at a 15 % recovery, and it is very nearly cancelled by the fact that recovering energy keeps the pack at a higher voltage for the whole race, which lowers the current everywhere else. Chapter 10 does that arithmetic. The conclusion for cooling design is that the requirement above does not need a regen allowance, but the charge current limit does need checking, because that is what really caps recovery.
Draw the thermal chain and find out where the resistance actually is
It is easy to spend most of your cooling effort on the link that is easiest to buy — the thermal interface material. Draw the chain out and put a K/W on every link, and the weighting usually turns out to be somewhere else entirely.
Read the chain against the requirement. The chain adds up to 2.64 K/W in the cooling document (2.61 for the four links in the figure), which is 0.38 W/K: about twice the 0.187 W/K the requirement asks for. At 5.62 W the core of an average cell then sits 14.8 K above the coolant, near 45 °C against a 60 °C limit. That margin is not spare, for two reasons. The coolant warms by about 8 K along the pack and cells at the edge run differently from those in the middle, so the hottest cell sits 8–12 K above the average, and the 60 °C limit applies to the hottest one CC §02; counted that way the requirement for the average cell is closer to 0.26–0.31 W/K. And the chain was computed for a contact area the channel does not have: drawn with its bond flange, manifolds and run-out, the channel touches 58 mm of the cell's 70 and the contact area is 17 % smaller, which moves the estimate about 15 % down CC §07. The design's range then becomes roughly 0.21–0.44 W/K around a central 0.32. The middle just meets the hottest-cell requirement and the bad end clearly does not. The cooling document calls this the largest single open item in the design; it is why the first module is measured before the others are built, and why chapter 12 uses this range as its example of a number that is not ready to lock.
Opening the chain up moves the design effort in two directions. The coolant boundary layer depends on channel height: in laminar flow, heat transfer goes inversely with channel height, so halving the channel doubles the heat transfer. And because pressure drop is typically a small fraction of what the pump can deliver, thinning it is close to free. The cell's shrink sleeve, on the other hand, is a given: you can't design it, but its thickness varies between cell types and it is worth actually measuring.
The third link, the cell's own radial conductivity, is the least certain number in the chain. Published measurements on cylindrical cells range from 0.15 to 2.6 W/mK depending on method, with careful measurements on 18650s clustering around 0.5–0.7; the cooling design uses 0.83 as an upper-end assumption KOLLER. That spread alone moves the core-to-surface link by a factor of two, which is one of the three reasons the first module has to be measured before the rest are built.
Warning · don't do this
Stripping the shrink sleeve to improve heat transfer is a bad trade. In a 180S pack it is one of two independent insulation barriers (a neighbouring cell can be a millimetre away and several hundred volts apart), and it stops cell-to-cell shorts. Ukkonen's calculation puts the gain at 0.6 °C compared to re-wrapping in a thinner film, in exchange for the entire cell-to-cell isolation. If you run out of margin, the right move is more cooling channels. CC §08
Parallel paths don't share flow evenly
This is the most common and most expensively learned mistake in cooling design, and it applies equally to air and liquid. When one manifold feeds many parallel channels, flow distributes according to pressure drop. If an individual channel's own pressure drop is small compared to the manifold's, the manifold decides the split — the nearest channels take everything and the far ones run dry.
The fix is counter-intuitive: deliberately add resistance. A restrictor at each channel inlet, with a pressure drop clearly larger than the channel's own, makes the channels look identical from the manifold's point of view, and the flow splits evenly.
Why not just run it hotter
The question always comes up: raising the temperature limit would relax the cooling requirement directly and save kilograms. The answer has three parts, and only one of them is about performance.
- Ageing. The Arrhenius relationship means a 40-degree increase multiplies the ageing rate, typically by six to ten.
- The feedback is positive. An aged cell has higher internal resistance, which produces more heat, which ages it faster.
- Safety margin. This one is a different category from the other two. Ageing is money; margin to the onset of an exothermic reaction is the rider. A thousand cells a millimetre apart means that if one goes, it propagates.
And the cell core is always hotter than its surface. If you measure at the surface and the limit is in the core, that difference is part of the sizing; it isn't something you can correct afterwards.
In plain terms
Thermal runaway
What it is. A lithium cell that gets too hot starts a chemical reaction that produces its own heat. Past a certain point the reaction no longer needs anything external to keep going: it accelerates on its own, the cell vents hot flammable gas, and it cannot be stopped by cooling.
Why it shapes the design. In a pack with cells a millimetre apart, one cell going can start its neighbours: that is propagation, and it is the failure that turns one bad cell into a total loss. It is the reason the temperature limit in this chapter is a limit and not a target, why the vent path is a designed feature rather than an afterthought, and why “could we just run it hotter?” gets a longer answer than it seems to deserve.
The related term SEI layer is the thin protective film on the cell's negative electrode. It starts breaking down somewhere above 80 °C, which is where the runaway sequence begins — so it is the number the 60 °C design limit is keeping its distance from.
Our case Mk4 · the 85 °C question, answered CC §09MOLIDARCY
85 °C would relax the requirement by a factor of 1.8 (h from 0.187 to 0.102), which in practice means a channel every fourth row instead of every second — roughly 4 kg. But the datasheet doesn't promise 85 °C anywhere: the discharge range is −40…60 °C and the absolute surface maximum is 80 °C. The cell's internal 0.72 K/W means an 80 °C surface at peak power is about a 91 °C core, which is already at the bottom of the SEI decomposition range. Four kilograms isn't worth it.
What happens when nobody decides the limit
Everything above assumes that somebody has chosen the temperature limit and written it down. The project's first race is what it looks like when nobody has. None of it is about a component failing. It is about two numbers, a BMS cut-off and an inverter temperature, that existed in the machine and in the paddock notes and were never compared to anything.
Our case Mk1 · fastest in qualifying, a minute and a half down in the race RACE22DIARYHISTLUT
The project's first race, Imatranajo 2022, is the cleanest statement of this chapter's argument that its own material contains. It is a result sheet, not a calculation.
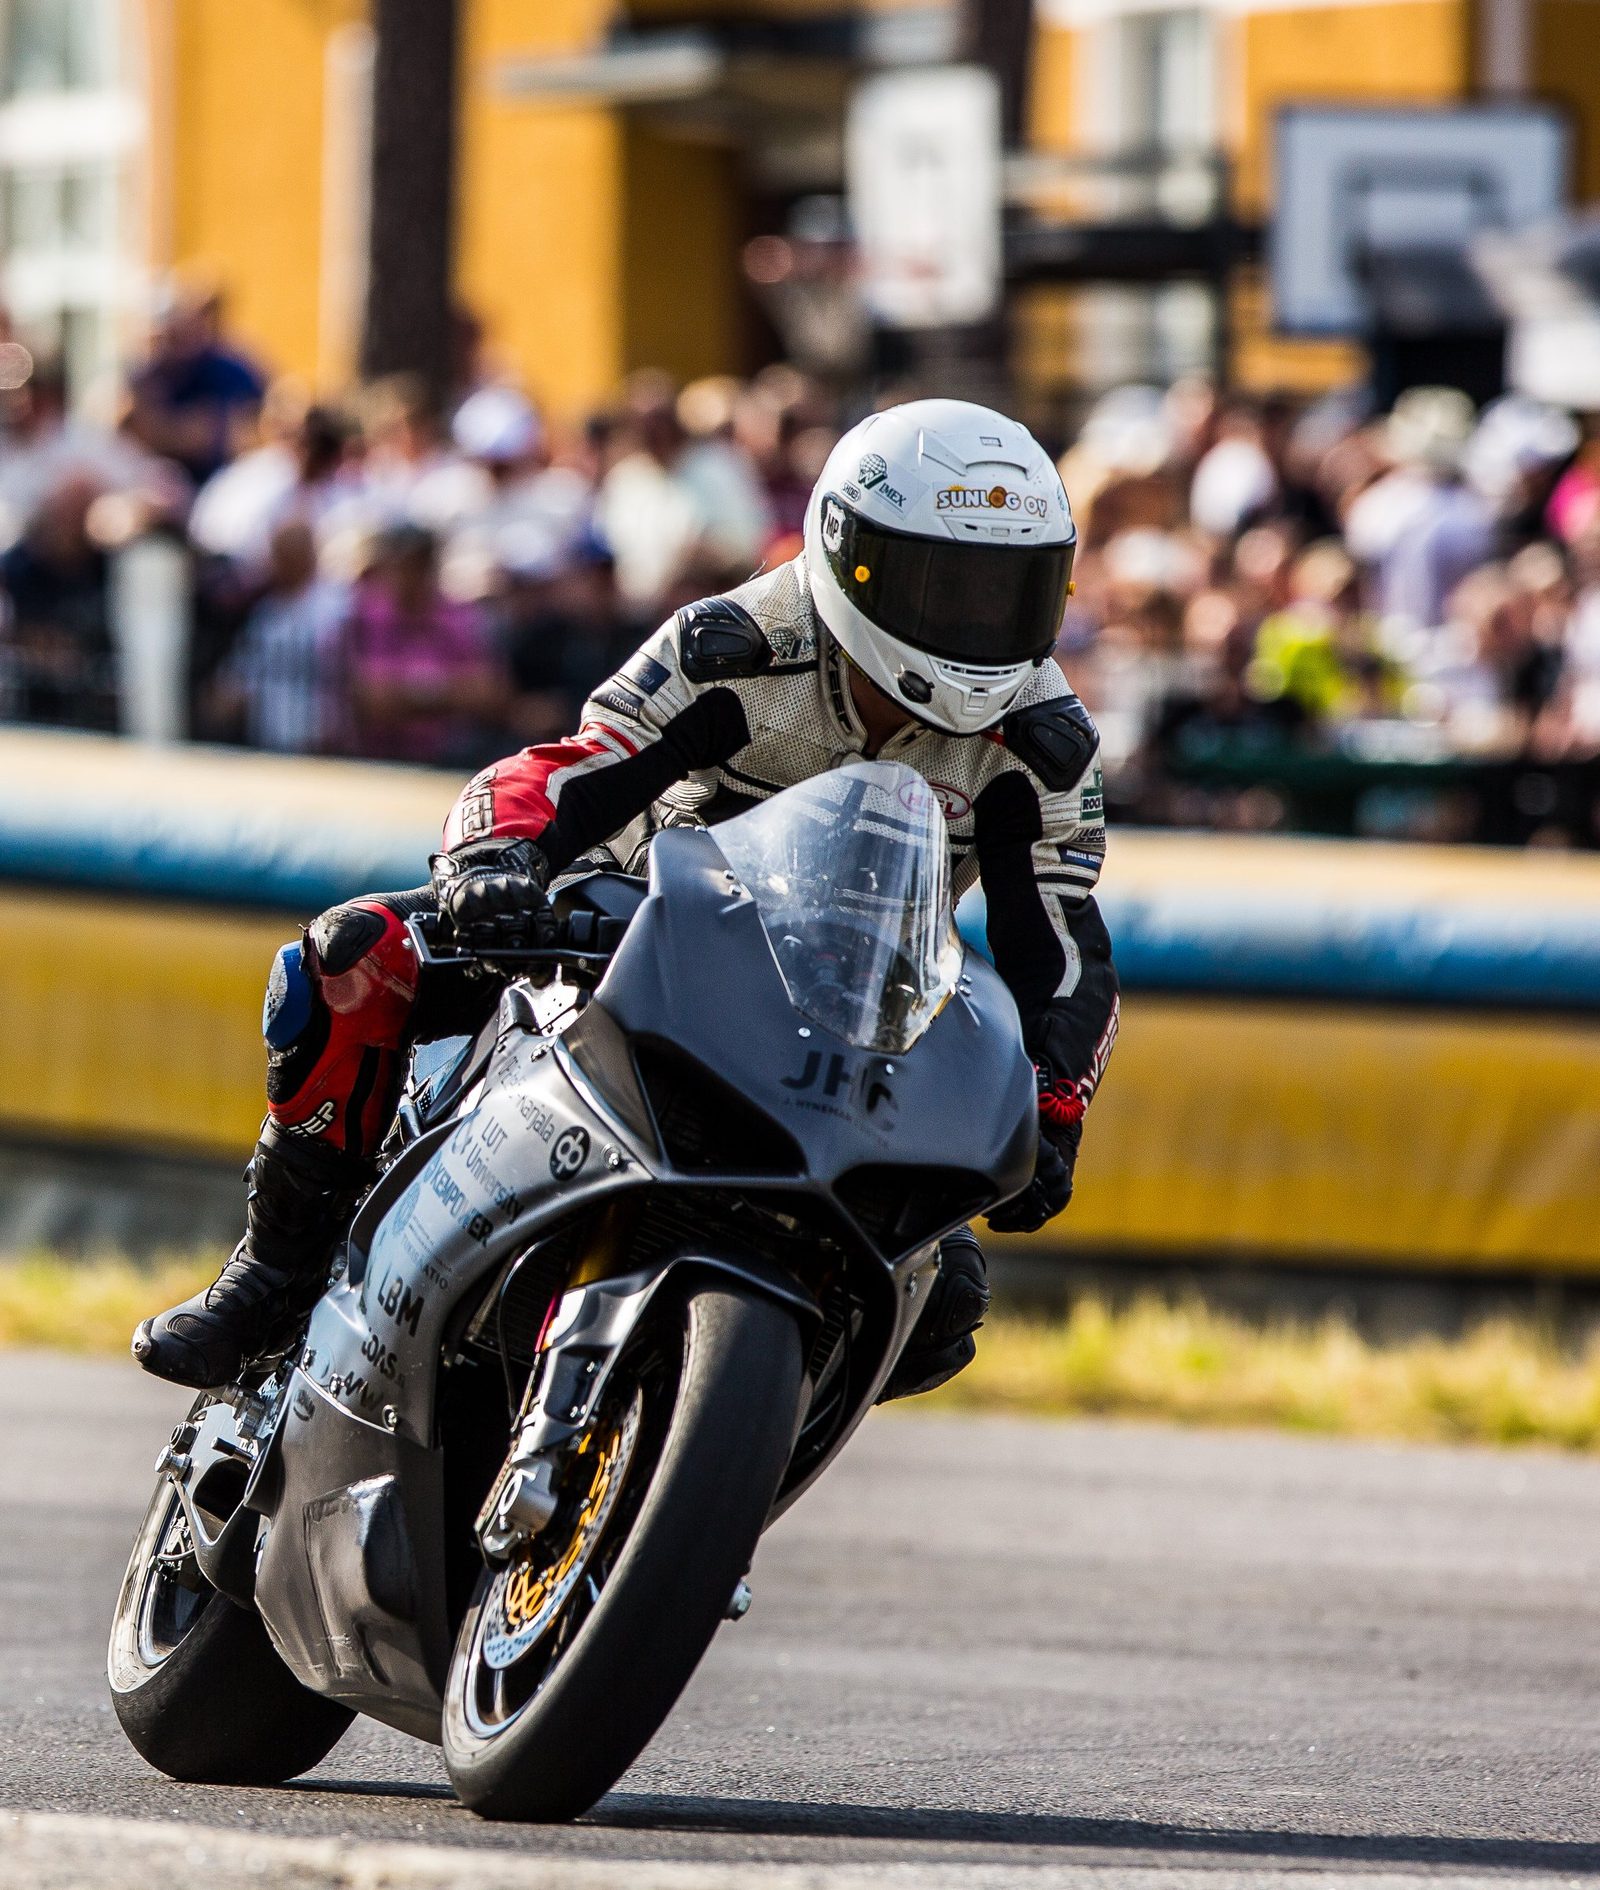
| Qualifying best | Race best lap | Three laps | Spread | |
|---|---|---|---|---|
| Winner · Delta XE | 2:26.923 | 2:28.783 | 7:30.201 | 1.3 s |
| Ukkonen Mk1 | 2:20.768 | 2:32.299 | 9:04.667 | 29 s |
| Gap | −4.2 % | +2.4 % | +21 % |
Mk1 qualified as the faster machine, and then lost the race by a minute and a half. The comparison worth relying on is the one that stays inside a single machine, because it assumes nothing about anybody else's day: Mk1's own qualifying best was 2:20.768 and its own best race lap was 2:32.299, 11.5 s slower, same bike, same rider, same circuit, a few hours apart. The winner's equivalent figure was 1.9 s, and its three race laps were within 1.3 s of each other where Mk1's varied by 29. The cross-team qualifying gap is weaker than it looks (the winner completed one timed qualifying lap in the whole weekend, so 2:26.923 says little about that machine's pace), and the chapter does not lean on it. The lap and race times are official timing; the competitor's power, mass and voltage figures used elsewhere in this book are that team's own published claims, and are treated as claims.
What the log says. Over the race the motor climbed from 48 to 93 °C. The inverter's reported temperature did not climb at all: it swung between about 50 and 109 °C on every straight, up under load and back within seconds — the "40 degrees up and down within one second" the team saw in the paddock tool, and the same 102–110 °C the inverter had reached at Motopark in June and would reach again at the airfield in September. In the inverter's own terms, its current target fell from near 300 A to 150 A within six to nine seconds of full throttle, so every straight began at full current and ended at half; the team's estimate that at most half the bike's power was ever in use is consistent with the pack side, where peak power fell from 87 kW in the first minute to 73–79 kW in the last. The pack's hottest cell went from 38 °C on the grid to 50. The ambient was over 30 °C, exceptional for a Finnish July, and every temperature in the log starts from it. HISTDIARY
And then the pack reached 50 °C. At 430 s into the race log, accelerating through 130 km/h with 209 A flowing, the pack current went to zero within a second and the inverter's status word changed, at the same moment the hottest-cell channel ticked from 49 to 50. The BMS's upper temperature limit was 50 °C, and it opened the circuit with the throttle wide. The bike coasted to a halt. About a minute later the channel read 49, the system was reset, the bike ran another 39 seconds and reached 185 km/h — and cut out again at 50. It then crawled to the flag at under 75 km/h. That is where most of the minute and a half went: not in the power fade, which cost seconds a lap, but in one integer nobody had been asked to decide, on a day when the pack started at 38. At the time the team attributed the stop to a voltage drop at the inverter, or possibly a fuse; the log, read four years later, says otherwise. Chapter 12 is about why that happens.
Two lessons, and the second is the one worth carrying. A qualifying figure tells you almost nothing about a race — here it told the opposite of the truth. And a thermal problem does not announce itself as a fault: nothing broke, no light came on, the bike simply got slower every lap while the rider kept riding it the same way — and when it finally did stop, the team blamed a fuse.
Our case Imatra 2022 · the warning nine days earlier, and the other team's version of the same weekend DIARYHIST
The failure had been written down before the race. At a test at Motopark on 22 June the paddock notes record the inverter at 102 °C, against a maximum of 70 °C at the first test three weeks before, next to the observation that "30 A seems to be the limit at which temperatures began to rise". The figure is as written in the notes; against the roughly 300 A the inverter was asked for on each straight, it is almost certainly a slip for 300 A. Both are good measurements, taken by people paying attention. Neither was compared to anything, because nobody had written down what the limit was. A temperature is not a measurement until there is a number beside it that it is allowed to reach, and that number is a design output, decided months before anyone is standing in a paddock with an infrared thermometer. The BMS's 50 °C was such a number; it had never been decided, only left.
The machine that won had the same disease in a different organ. Its team spent the weekend celebrating a new top speed — about 270 km/h, faster than any version of Ukkonen has ever run — while taping bags of ice around its battery, which was overheating. Each team had its own problem: their battery, our inverter and then our battery. Neither bike ran out of energy at Imatra: Mk1 crossed the line with 69 % in the pack. Both ran out of somewhere to put the heat, and each had cooled well the one component its own designers had worried about most.
Evaluate the alternative properly, then keep the negative result
Before committing to a liquid circuit it is worth putting the passive options through the same analysis, because they are lighter and simpler if they work. A published study of phase-change material and heat pipes on a generic pack at a 3C discharge (not this pack, and not commissioned by this project) found that performance improves as you add thickness but the target isn't reached LI. That is a negative result, and it is worth as much as a positive one: it is what makes the liquid-circuit decision defensible rather than merely conventional, and it stops the question being reopened every six months.
The time constant tells you when equilibrium arrives
A cell's thermal time constant is mass × specific heat / heat transfer coefficient. If it is roughly one lap long, the pack reaches equilibrium early in the race and your calculated temperatures are running temperatures rather than end-of-race peaks. If it is hours, the pack heats throughout and never equilibrates — and then you have to size by integrating rather than from a steady state. For a 70 g cell at 0.38 W/K the constant is about three minutes, so a KymiRing pack settles within a lap or two.
What actually sizes a cold plate
Once the required heat transfer is known, the plate itself is sized by three things, and only the third is thermal.
- Deflection, not stress. A pressed plate under internal pressure is a plate in bending, and the allowable deflection is reached before the allowable stress is. Size it on deflection and the stress case will pass; do it the other way round and the plate bulges away from the cells it is supposed to be touching.
- Off-the-shelf sheet thickness. A calculated optimum of 0.78 mm is not a thickness you can buy. Round to stock and re-check, rather than the reverse.
- Coolant layer thickness. Thicker is not better — past a few millimetres the extra fluid slows down and stops carrying heat away. Published optimisation studies for cold plates put the useful range at 2–3 mm COLDPLATE.
Our case a sized cold plate, and a number worth arguing with HUSUCOLDPLATE
For the 36-cell test module the plate was sized at 0.4–2.5 bar working pressure: at 1 mm thickness the stress limit allows a 33.8 mm channel span and a 0.5 mm deflection limit allows 30.8 mm, so deflection governs and the channel was set at 30 mm. 1.5 mm sheet was checked and gained nothing, so 1 mm was kept. The coolant layer was set at 3 mm from two independent optimisation studies.
Worth noting where this does not transfer: Mk4's radial dimension chain allows a 1.5 mm channel between cells, half the cold plate's 3 mm. The two are different geometries (a plate under a cell stack against a channel squeezed between cell walls), so the numbers are not in conflict, but the factor of two is large enough that the channel figure should be defended on its own terms rather than by analogy.
An idea that was right, arrived late, and failed on the joint
One of this project's better ideas never got tested, and the way it died is more instructive than the idea itself. A team member pointed out that the frame is thirteen kilograms of aluminium that is already on the bike, already in the airstream, and doing nothing thermally. Used as a buffer in the cooling system it would absorb heat the pack cannot hold.
Our case Mk3 · thirteen kilos of frame, and the sum nobody did LOGLOCT
The arithmetic is one line, and it was never done at the time, so here it is now. Aluminium holds about 900 J per kilogram per kelvin, so 13 kg is 11.7 kJ/K. Mk3's pack is 624 P42A cells at 70 g, about 44 kg of cells, and a lithium cell holds roughly 1 000 J/kg·K, so the pack itself is about 44 kJ/K. The frame would therefore have added a quarter to a third more thermal mass to the machine; the range covers the uncertainty in the cell's specific heat, which is the least certain number here.
What that buys is time, proportionally: the nine-minute session in this chapter's opening case becomes roughly eleven before the same temperature is reached. Real, and not decisive. And it comes with two conditions that are easy to miss. A buffer works once: after the session the frame is hot and has to be cooled before the next one, so it converts a heat-capacity problem into the paddock-time problem of chapter 11. And it does nothing at all for a long race, where what matters is the rate heat leaves the machine, not how much of it you can park somewhere.
Why it never happened is the useful part. The idea arrived after the frame was built. Retro-fitting it meant bonding aluminium tubing inside the finished frame, the epoxy joint did not hold, and the attempt was abandoned — not because the approach was unsound, but because nobody had read up on how aluminium is bonded before trying it. Aluminium carries an oxide layer that forms again within minutes of being abraded, so a structural bond to it is a surface-preparation problem first and an adhesive-selection problem second, and the joint has to be designed in shear with a controlled bondline rather than improvised into whatever gap exists LOCT. That is an afternoon's reading. It was not done, and an idea that might have been worth two minutes a session died of it.
Worth reopening? As a bolt-on buffer, no — the liquid circuit buys more for less. Mk1's frame was designed from scratch, but not with this in mind. If the next one is, the question changes shape: not can we glue tubes into a frame, but can frame members be coolant galleries from the first CAD model. That is how structural batteries and EV floor structures are built, it is decided at the same moment as the geometry in chapter 09, and it cannot be retro-fitted, which is exactly the lesson this case is an instance of.
Pick the adhesive by service temperature, not by strength
A detail that bites late. Structural adhesives are usually compared on room-temperature strength, but a bonded joint inside a battery pack sits continuously at elevated temperature, and what matters is the glass transition. An adhesive with a Tg below the joint's service temperature is a soft joint in service regardless of what the headline figure says.
Our case Mk4 · choosing the adhesive LOG 15 Sep 2026LOCT
The cooling-channel seam sits continuously at 40–52 °C. Of the three candidates, one has a glass transition of 27 °C, below the service temperature, so it was out regardless of its datasheet. The chosen variant is about twice as good hot in both shear and peel as the standard version of the same product, and it doesn't flow into the flow channel during cure. The two properties that decided it (hot strength and flow behaviour) are not the ones on the front page of the datasheet.
Sensor coverage is the cheapest performance you can buy
If the current limit is set by the hottest measured temperature but sensors are sparse, the system has to assume the worst. Sensor count and placement are therefore a direct performance question — and what settles it is the same measurement the thermal model needs: how much hotter is the hottest cell than the sensor reads? Nobody knows that number until it is measured, and it sets the cut-off threshold. It is also the 8–12 K spread earlier in this chapter seen from the BMS's side, which is one more reason to instrument the first module well.
Rule
Measure one module on the bench before you build the rest.
A thermal model is a chain of estimates with four unknowns in it: the cell's radial conductivity, the boundary layer in your actual geometry, the real sleeve thickness and, on this design, the contact area the channel actually achieves. The first finished module costs a few days and settles all four SAR. Don't lock the row pitch into CAD before then.
Part IV
The chassis
With the powertrain locked, the remaining lap time comes from mass, centre of gravity and grip, and the first of those is not a number you pick, it is a number the mission produces.
Mass, centre of gravity, grip — and rotating mass
Two of the biggest lap-time items live here. The thing most easily got wrong about mass is what kind of quantity it is. And some of it spins, which makes it two quantities at once.
This chapter settles how to think about mass, and where the rest of the time is. Mass sensitivity on a grip-limited circuit is around 0.02–0.025 s/kg in the project's own model and in Flanagan's validated model, and the MotoE generation change agrees in order of magnitude, not in the second digit (chapter 02) FLAWB s15. So thirty kilos is a little under a second. Since the battery on an electric bike is a hundred kilos, that is also where the kilos are.
Mass is an output, not a target
It is tempting to read a project's mass history as drift: every generation a little heavier than the last, discipline slowly failing. That is rarely what is happening, and reading it that way leads to the wrong fix, because the fix it suggests is “be stricter next time”, when the actual problem is usually that the number was chosen instead of derived.
Our case three generations, without a rider MBMETHB 30/60
| Generation | Mass | Pack |
|---|---|---|
| Mk1 | 262 kg weighed | 96S15P · 1 440 × Samsung 25S |
| Mk3 | 194 kg weighed | 104S6P · 624 × Molicel P42A · 9.6 kWh |
| Mk4 | 253.0 kg analysed · 219.6 kg target | 180S6P · 1 080 × Molicel P50B · 19.4 kWh |
Mk1 was heavy for reasons that had nothing to do with the mission: it was built deliberately over-safe, with several redundant layers of fusing, around a first-generation inverter of its era. Mk2 and Mk3 were the reaction (make the next one much lighter), and it worked: Mk3 weighed 68 kg less. Mk4 is neither: its cell count is sized from the heat load, and the heat load is sized from ten laps.
The original public target in 2020 was 150 kg. None of the three hit it, and 262 → 194 → 220 reads better as a search than as a trend line, and the middle point is the informative one: Mk3 was lighter than Mk4 will be, and it could not do the job: the 2024 session ended after nine minutes with 58 % of the charge still in the pack. Mass had been treated as the goal rather than as a consequence, and the bike came out under-specified for what it was for.
Two figures in that table are scale readings and one is a budget. Mk1 to Mk3 removed 68 kg, which on this circuit is worth about 1.6 s — the largest single gain in the project's history, and it bought a bike that could not finish the race. Mk4 then goes back up, deliberately: by 59 kg as currently analysed, and by 26 kg if the whole target column of the mass budget is achieved. The pack doubles in energy and gains a liquid circuit. That is the whole argument of this chapter in three numbers.
So the chain runs the other way round from the way it is usually discussed:
Chapters 07 and 08 are that chain. Cell count is the largest single line in an electric bike's mass budget, and it is not a free variable; it is whatever the thermal requirement says it is. Which means the right way to state a mass figure is as the outcome of a mission spec, never as a number picked in advance and defended afterwards.
Rule
Mass is what the mission costs. Minimise it inside the spec, never against it.
A lighter bike that cannot finish the race is not a lighter bike, it is a different bike. Decide the mission, let the thermal requirement set the cell count, and then fight for every gram in everything that is not cells.
And then fight for every gram
None of that is an argument for slack. The opposite: once the cell count is fixed, everything else is fair game, and the discipline is to size each part for what it actually carries rather than adding margin out of unease. Mk1 is the cautionary case in the other direction: redundant fusing layers added to be safe, never traced back to a requirement, and paid for in kilograms.
The practical test is whether a dimension can be traced to a number. If a part is 2 mm thick because someone worked out that it needs to be, that is engineering; if it is 2 mm because 1 mm felt thin, that is an unpriced kilogram. The busbar in chapter 07 is the live example, and so is the driveline: on a comparable bike two percent of gearbox efficiency is worth about 0.4 s a lap, which is more than the whole gearbox's mass is worth, so a lighter case is not the first place to look there either WB s15.
Our case Mk4 · design intent, early in CAD HB 30MB
CAD has started, but it is iterative and still early, so every Mk4 figure in this handbook is a target derived from analysis, not a weighed result, and the stated intent for the design phase is explicit: size each part as light as the numbers allow, and build nothing for safety's sake that cannot be traced to a requirement. The busbar is already earmarked to move from 2 mm to 1 mm on exactly those grounds.
That also puts the two figures in their place. 253.0 kg is what the current analysis says the mission costs; 219.6 kg is the target the mass budget sets against it with the technology available now, not a ceiling anyone is comfortable with, and not a floor either. It will move when CAD produces weighed parts, and the mass budget is where that gets recorded.
The mass budget is a living document
Start one on day one and keep it at line-item level: component, estimate, weighed value, target. Three things make it work:
- Estimate and weighed value are separate columns. Otherwise you have no idea how much to trust the total.
- Every new component gets a line the moment it is decided, not when it arrives. Otherwise the budget looks healthy because half the bike is missing from it.
- Decisions that add mass get logged where they are made. Going to liquid cooling, thicker busbars, a bigger enclosure: all of these originate somewhere other than the mass budget, and that is exactly why they go missing from it.
And then weigh the bike, because that is the only number that settles it. Mk3's line-item budget totalled 190.6 kg and the scale said 194 kg, 1.8 % light. That is a good budget, and knowing it is good is worth as much as the figure itself: it tells you how much to trust the next one before anything exists to put on a scale. A budget that has never been checked against a weighing is an assumption with a decimal point.
Our case the line that wasn't there MBHB 30
The busbars are the worked example of the second bullet. They were decided in the electrical design, they are not a chassis part, nobody owned them as a mass item, and they were absent from the budget entirely while weighing somewhere between 5.5 and 8.8 kg depending on thickness. That is close to a quarter of the whole battery-structure allowance, sitting outside the document that is supposed to track it.
The pattern repeats: the lines that go missing are the ones decided by someone who wasn't thinking about mass at the time. Coolant volume, potting compound, connectors, wiring loom, fasteners. None of them are anyone's headline component, and together they are tens of kilograms. The project's own weighing exercise found the same thing from the other side: the fairing estimate was 3.7 kg too high and the gearbox 4 kg heavier than assumed, so estimates err in both directions until a scale is involved.
Centre of gravity
CG height sets the wheelie and stoppie limits, which is to say how much acceleration and braking force you can use before the bike tips over lengthwise. On an electric bike CG is designable, because the battery is massive and you have freedom in where you put it. But that also means battery placement is the first thing that constrains CAD, before anything else can be locked.
CG also wants measuring rather than guessing: axle weights level and tilted will do it, and it is an hour's work. The geometry is one line: the stoppie limit is g × (horizontal distance from the front axle to the CG) / (CG height). On Ukkonen, with 0.70 m and a CG estimated at 0.60 m, that is 1.17 g; 50 mm lower gives 1.27 g, which is about 0.4 s of the braking-limit bar in chapter 03; the rest of that bar is regeneration. The project's own workbook carries the CG at 0.65 m in one place and 0.60 m in another, and at 0.65 m the same formula gives 1.08 g. The 0.60 m behind the 1.17 g, and the 0.4 s, come from the workbook's older sensitivity sheet, computed for the previous 104S pack WB s4; the locked-choices sheet repeats them, while its own open item carries 0.65 m WB s0. At 0.65 m the stoppie limit, 1.08 g, is below the 1.10 g braking limit the baseline simulation uses, so if the higher estimate is right the baseline is slightly optimistic. Until the bike is on the scales the 0.4 s is an order of magnitude, and that disagreement is the argument for the hour (open item O17). The 50 mm itself is a target, locked in the workbook.
Lower is not automatically better
The stoppie limit is the one place where a lower CG is a plain gain, and it is easy to read this section as saying as low as possible. On a motorcycle that is wrong, and it is the most common misconception visitors bring to the bike. CG height is a trade, and where the CG sits is a setup decision, not a quantity to minimise.
- Load transfer is how the tyres get loaded. Under drive, a higher CG moves more load onto the rear tyre, which is the tyre that has to put the torque down; under braking, onto the front. A lower CG transfers less, which raises the wheelie and stoppie limits but leaves the working tyre with less load to grip with.
- With wide tyres, a lower CG means more lean. The lean angle the bike itself needs for a given corner increases with tyre width and decreases with CG height. A low CG on race tyres therefore asks for more lean angle, and lean clearance is already one of the limits this chapter warns about.
- Leaned over, the CG is near the track anyway. At racing lean angles the CG sits far closer to the asphalt than its upright height suggests, so the car intuition that low is always stable does not carry over.
So the rule is the one this section already gives, stated more carefully: measure where the CG is, and move it on purpose. The 50 mm in the stoppie figure above, and in chapter 03's braking bar, is a target chosen for the braking limit, not a licence to build the bike as low as it will go. CG
Grip is the biggest single item — and you can't buy it as a part
Grip tops the sensitivity list, and it is a collection of decisions rather than one: tyres and their temperature, pressures, geometry and setup, how the suspension actually works, and rider time. The last is the one most easily overlooked. If the bike only ever gets ridden in single-lap bursts, the rider never reaches the tyre's real limit and the setup can't be developed.
Suspension, linkage and geometry follow the same rules on an electric motorcycle as on a combustion one, applied to the electric bike's own mass and centre of gravity. This book does not go into them, because the literature on them is extensive; Cossalter's Motorcycle Dynamics is a standard reference COSSALTER.
An electric bike also has a software route to grip: traction control and a corner-dependent torque limit. Those need a supervisory controller and a redundant throttle sensor, so they belong to electrical system design, but the benefit shows up on the grip line. If your simulation uses a fixed grip figure, a slip-ratio study for your own bike is what tells you how much of the gap that software could realistically close SAL.
Grip and braking are bought with track time
Together, grip and the braking limit are about 3.4 s of chapter 03's list: more than every other item on it put together. Neither is a part you can order, and on this bike that includes the brakes. The brakes are already from Brembo's racing range TEAM, so the hardware is not what limits braking. Mk3's hardest measured deceleration was 1.04 g, where the simulation assumes 1.10 g and a Superbike brakes at 1.3–1.4 g WB s4/s6. What raises the braking limit is the rest of the machine: the centre of gravity, through the stoppie limit above; the suspension setup, which decides how the load transfer arrives at the front tyre; engine braking from regeneration, which Mk3 barely had, so its rider was making up for it with the rear brake and was given a hand lever for it (chapter 12) WB s4; tyre pressures and temperatures; and the rider learning how this particular bike behaves on the brakes.
Grip is the same list with the tyre at the head of it: compound and size (the 180/60-17 in use now, a 200/60-17 under study, which needs a wider rim, room in the swingarm and a new chain line), temperature and pressure, geometry, and suspension that works in the range where the tyre is actually loaded. None of it can be found on a dyno or in a simulation. It is found by traditional setup work at a circuit: change one thing, ride a stint, read the tyres and the data, change the next, and do it again at the next circuit, because a setup belongs to a track.
Our case the kilometres the bike has not done TEAMWB s1
Ukkonen's riding so far adds up to a handful of test days and short sessions, much of it single-lap runs with a purpose other than setup. That is enough to calibrate a model and not enough to develop a chassis: the rider has to cover real distance on a machine he already trusts before setup changes start to mean anything, and that is where the largest remaining seconds are. The one time the project did it in miniature, between the July and August sessions of 2024, the rider's requests produced the calibration lap this book rests on (chapter 12). The riding time is the development item, and it needs a budget and a calendar of its own, not whatever is left over after the build.
Rule
Budget riding time like a component. Grip and braking come from kilometres, and a setup is only as good as the laps it was developed on.
Rule
Inherited parts are starting values, not finished solutions.
A swingarm, suspension or frame geometry borrowed from another bike is a fast way to get riding and a useful reference point. Weigh it and run the numbers anyway, because it was sized for a different mass and a different torque.
That rule has a practical form. The donor bike's own race-kit manual is the original source document for anything inherited (part numbers, suspension and geometry settings) and worth keeping rather than re-deriving. Against it, published stiffness targets give you something to design to: lateral stiffness of 0.8–1.6 kN/mm and torsional 1–2 kNm/° for a swingarm, and the separate finding that a frame's lateral stiffness can be reduced without giving up longitudinal stiffness CHASSIS. Ukkonen's inherited swingarm weighs 7.65 kg; a purpose-designed one in 7075-T6 within those stiffness ranges came out at 4.86 kg, which is the size of the prize.
Packaging serves the geometry, not the other way round
The largest components on an electric bike, the pack and the motor, are also the ones that arrive with their dimensions fixed, and there is a quiet way for them to take over: the pack is sized in chapter 07, the cells are laid out to fit, the motor goes where the chain line puts it, and the wheelbase, the lean clearance and the centre of gravity turn out to be whatever was left. Do not let the battery and motor packaging define the motorcycle's geometry by accident. A cell count that is optimal on the energy and heat arithmetic is not optimal if it costs a compromise on geometry that the rider will feel in every corner; 1 080 cells is this project's answer to a thermal question, and it stays the answer only as long as it fits.
Three practical consequences. Start from a known geometry (a donor chassis, or a set of published numbers, even when the frame itself is your own), because a known starting point is a risk removed, and this chapter has already said what it costs in mass. Package inside that geometry: the pack's envelope is an input to the module layout, not an output of it, which is the discipline chapter 04's 100S8P case learned by having to redo the layout. And check lean clearance in CAD, with the suspension at full compression and the tyre at its real profile, before anything is machined. Mk1's first test-day note was that the fairings touched the ground in a corner and the frame "had not been far from it" DIARY. That is a lean-angle limit set by a bodywork draughtsman, and the rider found it before anyone measured it.
Our case Mk1 · a frame of our own TEAM
Ukkonen does not sit in a donor motorcycle's frame. The frame was among the first things the project designed: it was drawn at the J. Hyneman Center and made by LUT Voima, LUT's prototype-manufacturing unit, from billet parts in 5083 aluminium, machined and welded together. It weighs about thirteen kilograms, the figure chapter 08's buffer case starts from.
What it bought is the freedom this section argues for. A donor frame is designed around a combustion engine, and an electric powertrain fitted into one has to live with the space the engine left. With a frame of its own, the project could decide the pack and the motor together with the frame. Two decisions show it: the motor was placed where it left room for more cells, and the frame's width was matched to Mk1's cell count, so the pack filled it without empty space around it.
What it did not buy is certainty. A new frame is a geometry nobody has ridden, which is why the rule to start from known numbers still applies, and the parts that were inherited, a Yamaha R1 swingarm among them, are exactly the parts the rule earlier in this chapter is about. A frame is also a decision fixed early. The same frame carried Mk1, Mk2 and Mk3, so a width matched to one pack became the envelope every later pack had to fit, and chapter 08's frame-as-buffer idea arrived after the frame was built and could not be designed into it.
In plain terms
Why the alloy matters for a welded frame
Aluminium alloys get their strength in one of two ways. The heat-treatable alloys, such as 6061 and 7075, are strengthened by a heat-treatment step, and welding heat partly undoes it: the metal next to the weld comes out markedly weaker than the rest of the part unless the whole structure is heat-treated again, and 7075 is generally not considered fusion-weldable at all. The non-heat-treatable alloys, such as 5083, get their strength from what they are alloyed with (magnesium, for 5083) and from cold working, so a weld costs them much less. That is the general reason 5xxx alloys turn up in welded structures, and why the question for a welded frame is not simply which alloy is strongest on the datasheet but how strong it is after welding.
Rotating mass counts twice, and the two counts scale differently
Last in this chapter because it is the smallest item in it: about a tenth of a second against the lighter rotor of a radial motor WB s15, 0.14 s against no rotor at all, and an effect on handling that is real but has no number in seconds. It is here because it is a design choice that costs nothing if it is made early.
Everything above treats mass as a single number. Rotating mass is not one: it appears in two places, with two different laws, and a design decision that is bad in one can be good in the other. Both laws are about the same quantity, the moment of inertia I of whatever spins, and about the gear ratio G between it and the wheel.
During acceleration, inertia is reflected as I · G². The motor has to accelerate itself as well as the bike, and because it spins G times faster than the wheel, its inertia is felt at the wheel multiplied by G squared. Divide by the wheel radius squared and you have an equivalent mass in kilograms, which goes straight into the mass sensitivity from chapter 03.
In direction changes, angular momentum is reflected as I · G. Angular momentum is I·ω, and ω scales with G to the first power, so the gyroscopic term grows more slowly with gearing than the inertia term does. And unlike inertia, angular momentum has a sign: something spinning the other way subtracts from the total instead of adding to it.
The second one is why MotoGP engines rotate backwards: angular momentum couples roll into yaw, so a machine with a lot of it resists being placed, and turning part of the total around reduces the coupling SPALD. The same option exists on an electric bike, and it is very much cheaper there: a crankshaft has to be reversed with an idler gear and a redesign, while a motor's direction is a phase order and a gear pair.
Our case the motor turns backwards, and it was free WB s15FLASPALD
The motor was deliberately given the opposite rotation to the wheels, to cancel part of their gyroscopic moment. The effect has never been calculated. It can be estimated, and it is larger than expected:
| Quantity | Value | Where from |
|---|---|---|
| EMRAX 268 rotor inertia | 0.0922 kg·m² | Published, via the doctoral thesis FLA |
| Overall ratio G | 2.5 | Gear pair × chain |
| Rotor, reflected as angular momentum I·G | 0.231 kg·m² | Derived |
| Wheels, tyres, discs, sprocket | ≈ 1.3 kg·m² estimate | Built up from component masses — to be weighed |
| Rotor as a share of the wheels | ≈ 18 % | Derived |
| Reversed versus same-direction | ≈ 30 % less total | Derived |
| Rotor, reflected as inertia I·G² | 0.576 kg·m² ≈ 5.7 kg ≈ 0.14 s | Derived, at 0.024 s/kg |
The same property that makes an axial-flux rotor expensive to accelerate makes it valuable to reverse. Its 0.0922 kg·m² is four times a comparable radial machine's, and the project had already checked that this costs about 0.08 s against that alternative and accepted it. On the other axis the same number is an asset, and nothing in the project had noticed.
It cost nothing, for a reason that is the general case. A gear pair was in the design anyway: the Ø268 mm motor makes a direct chain run awkward to package, and the drive sprocket has to sit where chain tension does not fight the suspension under power. A gear pair reverses rotation as a by-product, so the gyroscopic benefit is the third thing a part bought for two other reasons happens to do. And on a single ratio it is worth the same in every corner, where a gearbox machine's varies by a factor of four between first gear and top. The 18 % and the 30 % rest on an estimated wheel inertia and will move together when the wheels are swung on a pendulum (open item O12).
What this does not say
None of this converts into lap time. At 150 km/h and a roll rate of 2.5 rad/s the difference between the two directions is of the order of 150 N·m of yaw moment, a couple of percent of what the tyres can generate: it changes how readily the machine changes direction, not where the grip limit is. A number in seconds would need a multi-body model with a rider in it, which is a thesis in its own right.
Rule
Take the free ones — and write down that you never priced them.
Not every decision has to be justified in seconds. When an option costs nothing and points the right way, take it. What it does need is a line in the decision log saying it was never quantified, because otherwise somebody downstream will credit it with a tenth it never earned, and budget against it.
Part V
Making it work
The parts that don't appear on any drawing: the settings that quietly cost seconds, the safety work that can't be added afterwards, and the method that keeps a project's numbers trustworthy for three years.
Electrical system and settings: the invisible loss
A setting can cost more than a component. It is the cheapest place to find time and the hardest place to notice it's missing.
This chapter settles what has to be verified rather than assumed. Inverter and BMS parameters are design choices as much as anything mechanical, but they don't appear on any drawing. A wrong parameter doesn't break anything either: the bike works, it just works worse than you think, and you only see the difference in the data.
In plain terms
The three boxes that argue with each other
- Inverter
- Turns the battery's DC into the AC the motor needs, and decides how much torque the motor makes. It is what the throttle actually talks to: the rider asks the inverter, not the motor.
- BMS
- Battery management system. Watches every cell's voltage and a set of temperatures, keeps cells balanced, and publishes how much current the pack is willing to give or accept.
- DCL / CCL
- Discharge and charge current limit, the numbers the BMS publishes. If the inverter honours them, they are your real power limit, whatever the motor could otherwise do.
- Derate
- Reducing a limit progressively as a protective measure, usually on temperature. A derate that starts too early, or falls too steeply, ends your session for you.
- CAN bus
- The network these boxes talk over. Fine in principle; the catch is that a message nobody is listening to looks exactly like one that is working.
Why this matters here. Two of these three can limit your current independently, and the third is the network in between. Most of the losses in this chapter are about which one was actually in charge, and whether anyone had checked.
Our case Mk3 · the bill for settings EEPROMO2BMSAiMHB 50
| Mistake | Consequence |
|---|---|
| Regeneration effectively off | 44 % of tractive energy went into the brakes; regen recovered under 2 %. Worth about 0.9 s a lap together with a lower CG; the simulation values the two as one braking-limit change and does not separate regen's share. |
| Flux left at the inverter's default for the motor type (0.066 Wb), above even the datasheet's | Torque command and telemetry 20 % out. |
| BMS temperature derate starting at 40 °C | Session ended in 9 minutes, when the discharge-current-limit (DCL) table in the Cascadia module and BMS info book allows full current to 60 °C CMM. |
| Torque rate limit at 5.0 Nm / 3 ms | 0 → 300 Nm took 180 ms. Small, but free to fix. |
| No undervoltage protection in the inverter | Protection resting entirely on a CAN message with a 1 s timeout. |
| Analogue throttle, no CAN control mode | No traction control, no launch control, no corner-dependent torque limit. |
Added up, a couple of seconds and a session cut short — and not one of them needs a new component.
Two limiters, and which one bites
Current limiting typically comes from two places: the BMS requests a limit and the inverter enforces its own. You need to know which one bites when, and in particular whether the BMS request is connected to the inverter at all. An integration implemented over a bus looks identical from the outside whether or not it works.
Rule
Protection implemented over a CAN bus has to be verified by measurement, not assumed to work.
Raise the load until the limit activates, and log the BMS's requested limit, the inverter's actual limit and the reason code side by side. It is one bench run, and it is the only way to tell working protection from protection that looks like it works.
In plain terms
Regeneration
What it is. Running the motor as a generator while slowing down, so braking energy goes back into the pack instead of into the brake discs as heat. On a circuit it recovers a meaningful fraction of what you spent accelerating.
Why it's not free. The pack has to be able to accept the current, which is a separate limit from the one that governs discharge and is usually much lower. And a full pack can't accept anything at all. So regeneration is as much a battery and BMS question as a motor-control one, which is exactly why it fails silently.
Regeneration isn't just a setting
Getting regen to work needs three things at once, and if one is missing it doesn't work at all: the inverter's regen limit set high enough, the BMS charge current limit raised to what the cell will actually take, and a starting state of charge below full so there is room to put energy back on lap one. On a fully charged pack regen is off until SOC drops — which is exactly the laps you are riding hardest.
It is worth being clear about why it is being tuned at all, because regen is three different things at the same time and they do not have the same answer.
- It is energy. On a pack sized for the race distance it can be the difference between finishing with margin and finishing on fumes.
- It is how the bike behaves on corner entry. A rider arrives at a corner expecting the machine to slow when the throttle closes. Without it the bike free-wheels in, the rear stays light, and the chassis is harder to settle. This is the one that sets a floor. Some retardation on a closed throttle is a handling requirement whatever the energy budget says, so the question is never whether to have regen, only how much, and shaped how.
- It is heat, and it can only ever add. Ohmic loss is I²R, which does not care about the sign of the current: ten amps in heats the cell exactly as much as ten amps out.
What it actually costs in heat
The third item sounds worse than it is, and the arithmetic is worth doing once because the result changes how you tune it. The drive side is unchanged (the bike needs the same traction energy either way), so the extra heat is only the ohmic loss of the charging events themselves:
Qextra ≈ Eregen × ( Iregen · Rcell / Ucell )
That is the recovered energy multiplied by the cell's ohmic loss fraction at the regen current, and because regen current is a fraction of drive current, so is the loss fraction. It also gives the ceiling directly: even if regen were taken at the full drive current, the penalty could not exceed the drive-side loss fraction times the recovered energy.
Our case Mk4 · what 15 % regen costs the cooling system WB s3LOAD
On the locked configuration (180S6P, 21.2 Arms per cell, measured cell resistance 12.5 mΩ, a 117 s lap, and 0.91 kWh going into the brakes each lap), the cells produce 6.07 kW, or 198 Wh per lap. Against that baseline:
| Recovery | Spread over | A/cell | Extra heat |
|---|---|---|---|
| 15 % | 15 s of braking | 8.4 | +4.0 Wh · +2.0 % |
| 15 % | 20 s | 6.3 | +3.0 Wh · +1.5 % |
| 15 % | 25 s | 5.1 | +2.4 Wh · +1.2 % |
| 30 % | 20 s | 12.6 | +12.0 Wh · +6.1 % |
| ceiling for 15 % — at full drive current | — | 21.2 | +9.8 Wh · +4.9 % |
And there is an offset that very nearly cancels it. Recovering energy means running the whole race at a higher state of charge: 13.9 % at the flag instead of 6.7 %, which averages about 3.6 points higher across the race. That is roughly 0.9 % more cell voltage, so 0.9 % less current for the same power, so 1.8 % less ohmic heat for the entire distance, against the 1.5 % the recovery cost. At 15 % recovery the two are the same size and regen is thermally free. At 30 % the balance tips, but only by a couple of percent, against about 1.4 kWh more recovered than at 15 % — a lap's worth of margin.
For scale at the other end: Mk3 recovered under 2 % of its traction energy, so its regen heat was around a tenth of a percent. The question never arose.
In plain terms
Why the shape matters more than the amount
Recovered energy scales with current, while heat scales with current squared, and those two facts together are the whole tuning insight.
Take the same energy back twice as hard over half the time and you have recovered exactly the same kilowatt-hours for twice the heat: the current doubles, the loss rate goes up four times, and it lasts half as long. The three 15 % rows in the table above are the same recovery and differ only in how long it is spread over — and the heat falls by about 40 % from one end to the other.
So: spread the recovery across the whole braking event rather than taking it as a spike. The front brake does the work at the start of the zone anyway; let the regen run deep into corner entry instead of front-loading it. It needs no new parts, it is a map rather than a part, and it also reduces the peak charge current, which is the constraint that actually binds.
That is the electrical answer, and it may not be that simple on track. What affects this most is the rider and his riding style. How the rear wheel slows, and when in the braking zone the regen arrives, decides whether he can brake and turn in the way that comes naturally to him, and that has more effect on lap time than the shape of the regen curve TEAM. So the profile above is something to explain to the rider and try with him, not something to impose on him. If he can adapt to it, it is worth trying; if it fights his corner entry, the lap time will show it before the heat does, and lap time takes priority.
Which is the real conclusion: heat is not what limits regeneration. The cell's charge current limit is, and it is usually far below its discharge limit; after that comes the BMS's own limit and its derate near full charge, and then the inverter's regen torque setting. All three are settings or datasheet numbers rather than thermal physics.
Our case Mk3 · three settings, not a physical limit EEPROMO2BMSWB s0
44 % of Mk3's traction energy went into the brakes; regeneration recovered less than 2 % of the total. Three numbers explain all of it, and not one of them is about temperature: the inverter's regen torque limit was set to 10 Nm with a braking term of 1 Nm; the BMS charge current limit was 50 A, derated above 85 % SOC by 3 A for every percentage point, with a second derate above 40 °C; and the pack started every session near full (91 % in the session this book is calibrated on, where the log shows 32 A available, about 5 A per cell).
The cell datasheets supply the ceiling this case needs. The P42A on Mk3 is specified at a standard charge current of 4.2 A per cell, with charge curves up to 8.4 A, so the 5 A the BMS allowed at the start of a session sat just above the standard rate. The P50B on Mk4 allows up to 25 A of charge per cell, with a 70 °C cut-off, which is what makes Mk4's 15 % target reachable at all. MOLI
One more term exists and is worth knowing about without being designed around. Reversible, entropic heat changes sign with current direction: a cell that produces a little extra heat on discharge absorbs a little on charge. At the regen currents above it is of the same order as the ohmic term, so it works in regen's favour — but its sign varies with state of charge, and this project's thermal model is ohmic only, so it is a reason the estimates above are conservative rather than a number to spend.
What you have to build to collect the electric advantages
Chapter 01 tabulates what the architecture gives back. None of it arrives by itself; each item is collected only if something is built to collect it.
- Commanded torque needs an accurate Kt. The inverter knows the torque it just applied only as well as it knows the torque constant, which is why chapter 05 asks for it to be measured. Any loop closed around wheel slip depends on it.
- Fine torque control needs a supervisor. The current loop can move torque in milliseconds and in small steps, but only a vehicle controller in CAN control mode, with a redundant throttle sensor, can use that for traction control, launch control or a corner-dependent torque limit. Mk3 had an analogue throttle and none of the three.
- Engine braking has to be mapped. Drive and regeneration are one control law, so retardation on a closed throttle is a map by speed and by position on the circuit, not a property of the engine. Someone has to write the map, and the regeneration sections above are what it has to respect.
- The mass does not change during the race. A combustion bike finishes twenty-odd kilos lighter than it starts; setup has to be right for the whole distance at the start weight.
Warning · the rider cannot hear the tyre
A rider hears the rear tyre let go. On a combustion bike a slide arrives as a rise in engine note, immediately and unmistakably, and riders steer by it. An electric bike is quiet, and its low single ratio means the speed change is small as well. One of the rider's feedback channels is simply absent. That is not an argument that electric bikes benefit from traction control; it is an argument that they need it, and that the cost of not having it is higher than the same omission on a combustion bike.
Check the resolver's electrical alignment, not just the mechanical one
The resolver is the rotor-position sensor: it tells the inverter where the magnets are at every instant, so that the current can be placed correctly against them. It gets three sections here, because this project got the same component wrong three separate times and each failure had a different shape: a wrong offset, a wrong timing and a wrong direction, in the order of the three sections below. In each case the symptom pointed somewhere other than the sensor.
A subtle one worth knowing about in advance. If the position sensor and the motor have different pole-pair counts, mechanical and electrical angle are not the same thing, and a small mechanical misalignment becomes a large electrical offset. Changing the sensor without recalculating the offset leaves a value behind that looks plausible and quietly costs torque.
The offset matters because it is the angle at which the current vector is placed relative to the magnets, so it sets torque per amp and efficiency directly. The inverter manual asks for it within ±0.7 electrical degrees, and the procedure is a coast-down with the inverter disabled, reading the angle between back-EMF and resolver CASC §4.1.3. It is half an hour on a bench.
And it follows from this that the sensor's physical position is a calibration parameter. Taking the drive apart and reassembling it in a different clocking invalidates the number, without anything looking wrong afterwards. Any procedure that separates motor and sensor has to end with "recalibrate the offset" written in it.
Our case one degree that was ten LOG 9 Sep 2026CASC
The resolver has 5 pole pairs; the motor has 10. So one degree of mechanical misalignment is ten electrical degrees. The inverter's alignment offset had been left at the value set for the previous sensor, and the correction, made between two dyno sessions, moved it from −52.0 to −66.1. Nothing about the bike indicated a fault — it just made less torque per amp than it should have.
An error that grows with speed is a delay, not a fault
The offset above is a constant: get it right once and it is right everywhere. The second failure is the one that survives a correct calibration, because it is zero at the speed you calibrate at and grows from there.
The diagnostic move is general and worth having: plot the error against the thing it varies with, and the shape names the mechanism. An error that is constant is an offset. An error that scales with speed is a time — something measured at one instant and acted on at a later one. An error that scales with current is usually saturation. You do not need to know the cause to read the shape.
Our case Mk2 · 129 A of regen nobody asked for CMS Oct 2023CASC §4.1.3
The symptom was at the other end of the machine from the cause. Closing the throttle from speed produced a large negative current spike: regen was limited to 25 Nm and the torque feedback showed −43.2 Nm, with −129 A going into the pack. A 1.7× overshoot on a limit that was set correctly.
The first hypothesis was the torque rate limit, set high at 2 000. With the manufacturer's support the team also checked the resolver calibration and the cable shielding. All were sensible things to rule out, and none of them was the cause.
What settled it was a table. With the alignment calibrated to exactly 90.0° at 1 000 rpm, the angle was read at four speeds while the motor coasted down:
| Motor speed | Measured angle | Error |
|---|---|---|
| 2 000 rpm | 87.0° | −3.0° |
| 1 500 rpm | 88.5° | −1.5° |
| 1 000 rpm | 90.0° | 0 |
| 500 rpm | 91.5° | +1.5° |
Dead straight: 3.0 electrical degrees per 1 000 rpm. That rules out noise, which is not linear in anything, and it rules out a miscalibrated offset, which would not be zero in the middle. A constant angle per unit speed is a constant time. On a ten-pole-pair motor 1 000 rpm is 60 000 electrical degrees per second, so three degrees is about 50 microseconds: a latency between sampling the position and acting on it.
The fix was the inverter's own angle-advance term, set to −58, after which the angle held at 90° across the range and the regen spike went away. Angle advance is not normally needed with this kind of resolver, which is why it was not the first thing anyone reached for. The measurement found it.
Except that somebody had said it a year before, in the same email as the sign-convention warning below: the 2022 outside review (chapter 12) noted that good position information needs its amplitude and offset calibrated and its latency as well, especially where the controller cannot calibrate latency itself REVIEW22. Amplitude, offset, latency — the three-part sequence this section is built around was handed to the project in one sentence in October 2022, and the project then discovered the second and third parts of it the expensive way.
It was a battery problem too. The 129 A of unrequested charge current was more than a control nuisance: it goes into the pack, past whatever the BMS charge limit was set to expect, in the part of the lap where the cells are already warm. A torque-control fault and a battery event can be the same event, which is an argument for logging pack current at the same rate as torque, and for reading them together rather than one at a time.
A sign convention can be a feature switch
The third failure belongs to the same commissioning step, and it was the most expensive of the three. Every inverter has a notion of which way is forwards, and it is set by two independent things: how the resolver is wired, and the order of the motor phases. Get either backwards and the machine still runs perfectly well; it just reports a negative speed. That can look cosmetic, although it may not be.
The manual will usually tell you how to check the direction. What it is much less likely to tell you is which functions stop working if the sign is wrong, because from the manufacturer's point of view the direction is simply part of a correct installation and not a setting with consequences. So the check reads as informational, and gets treated as informational.
Our case Mk2 · 2023 · a minus sign that cost a test day CASC §4.1.2EEPROMLOG
On first commissioning the new inverter, the resolver wiring and the phase order were set from an ambiguous reading of the manual and ended up inverted. The inverter reported speed as a negative number. Everything ran. Nobody thought a sign mattered: the previous inverter had been driven in both directions without caring.
The bike was taken to an airfield to be run at speed for the first time. The revs stopped exactly where field weakening should have begun. Below the base speed nothing is wrong, because field weakening never engages; above it, the inverter would not field-weaken in the negative direction at all. The result was a whole test day lost at the one place and on the one day where it was most expensive — which is also the only place the fault could ever have appeared.
The manual does contain the check. There is a section called Verifying Resolver and Motor Direction that says exactly what to look at and states that forward rotation must read positive. What is easy to miss, reading the two sections separately, is that field weakening depends on that check.
And the fault had been named a year earlier, by someone who had never seen the bike. In October 2022 the outside reviewer of chapter 12, looking at screenshots of the previous inverter's settings and logs, pointed out that the Iq target was negative while the throttle demand was positive, so the motor might think it was spinning in reverse, and suggested changing the configuration or phase connections so that positive rpm, positive Iq and positive torque demand all coincide REVIEW22. That is the same convention error, on the earlier machine, diagnosed from a screenshot. It arrived as item one of eight in a helpful email, did not look urgent, and was not carried across to the new inverter.
And it is not a beginner's fault. When the team described the crossed resolver wiring to the people at the Lightning Motorcycle factory in January 2024, one of them finished the story before it was told: field weakening cannot have worked. Nobody had told them that part; the symptom was recognised from three sentences LIGHT. That is what a mature field looks like from the outside: the knowledge exists, it is written down nowhere, and it passes from team to team when somebody recognises your symptom.
It is worth noticing how early this class of fault first appeared, and how harmless it looked then. On Mk1's very first test day, in June 2022, an adjustment to the angle offset was deliberately made large — "not just by two units but by twenty", to see what it would do, and the rear wheel turned the wrong way in the paddock DIARY. Somebody laughed, the value was reduced, the bike went back out. That was the same relationship between believed angle and actual direction, in its visible, instantly diagnosed form. A year later the same relationship appeared in its invisible form and cost a test day.
Four things come out of that, and none of them are about resolvers.
- An unexplained sign is an unexplained fault. Resolve it before the test day, not after it. Anything a system reports that you cannot account for is a finding, however cosmetic it looks.
- Commission against the envelope you will use, not the one you are in. A workshop run never reaches the base speed, so an entire region of the control law is untested by construction. Write the commissioning plan around the features you will need later (high speed, field weakening, regen, current limits) and find a way to exercise each one deliberately.
- What the previous component tolerated is a debt, not an inheritance. The old inverter did not care about direction, so the check had quietly left the list. When you replace a component, the dangerous items are the ones you stopped checking because the last one forgave them — and there is no list of those anywhere.
- A procedure tells you how to check; it rarely tells you what breaks. When a manual asks you to verify something and does not say why, that is the point to find out, because the answer is the difference between a five-minute check and a lost day.
Two words, two documents, one shaft. If you reverse the motor's rotation on purpose, as chapter 09 describes, then “backwards” mechanically has to be “forwards” electrically, and those two words come from different documents written by different people. The condition is not one thing but two, and they have to be recorded together: the mechanical direction relative to the wheels, and the requirement that the inverter sees that direction as positive. If the motor mounting, the gear layout or the phase order changes, the same fault comes back — and again it will only show above the base speed.
A settings mistake can cost the season, not the lap
Everything above is about settings that cost performance. There is a second category, and it is worse: settings that cost availability. A machine that is slower can still be developed. A machine that will not turn on cannot.
Three properties make configuration work unusually dangerous, and they compound.
- Scaled parameters. Many inverter and BMS parameters are stored as integers with an implied scale, and the scale is in the parameter's name:
..._x_10for tenths,..._x_100for hundredths. A factor of ten in a limit does not produce an obvious error; it produces a machine that refuses to operate for a reason that points somewhere else. - Some of the configuration is unique to your unit. Alongside the settings you choose sit factory calibration constants: the gains and offsets of that individual unit's voltage and current sensing, measured on that serial number at the end of the production line. They are not in any manual and not in a generic defaults file.
- Recovery may depend on the supplier's support, so plan risky configuration work for when it can be reached, and never against a booked dyno slot.
Our case Mk2 · one digit, one summer CMS Jun–Aug 2023CASC
The bike ran for the first time on 26 June 2023 and the resolver was calibrated the next day. On the morning of the 28th, with a dyno session booked for that evening, the team was doing the final EEPROM set-up; the bike and the inverter had been working perfectly in VSM mode, with the calibrations done. The parameter DC_Volt_Limit_EEPROM_(V)_x_10 was set to 450 where it should have been 4500: the value is in tenths of a volt, so the inverter was given a DC voltage limit of 45 V instead of 450 V. The pack was at 370 V. TEAM
What followed did not look like a wrong limit. The inverter reported “DC Voltage below Min”, failed precharge, showed nothing at all for DC voltage (V_DC_Filtered stayed blank even after precharge), and its module temperature readings (Mod_Temps) went false, drifting towards −273 °C — which reads as a wiring fault, and the team measured the pack at the connector to prove the voltage was there. Reverting to the factory EEPROM did not help. Neither did two firmware versions in both directions.
The manufacturer found it: the unit's factory calibration data had been lost at some point during the programming. Nobody had knowingly changed it. The causal link between the typo and the corruption was never established, and this book does not claim one. What is certain is where the symptoms were: not in the parameter that was wrong.
The manufacturer restored the calibration from its own records and fixed what the team could not have. The fix came after the summer, and the wait cost that evening's dyno session and a good deal more.
Rule
Back up the configuration as it shipped, before you change anything, and keep it with the serial number.
Then back it up again after every session of changes. The manufacturer asked for a fresh EEPROM backup at every single step of the diagnosis, as routine, and the only reason the problem was solvable at all is that the edited files existed to compare. A factory-defaults file is not a backup of your unit: it restores the settings and not the calibration.
One smaller habit falls out of the same episode, and it is free: check which variant of the firmware your hardware wants: this inverter ships two builds selected by motor type number, a distinction that is documented and was missed, and which muddied a week of diagnosis for no reason.
Safety is design work, not paperwork
Some requirements can't be added afterwards and belong in the CAD phase rather than in race week.
This chapter settles what has to be in the design from the start. Above 60 V DC the FIM's technical guidelines for electric motorcycles put a system in voltage class B, the high-voltage class FIM23; other codes draw the line in their own place, so check the one that applies to you. There is no way around that, and no reason to want one: most of the requirements are things a well-designed machine would meet anyway.
In plain terms
Why DC is harder to switch off than AC
Mains AC crosses zero volts a hundred times a second. When a switch or fuse opens and an arc forms, that zero crossing puts it out. A battery has no zero crossing. An arc struck in a DC circuit has nothing to extinguish it, so the component has to do the work itself: with arc chutes, quenching material, or sheer physical separation.
- Rated voltage
- What the part can sit at without breaking down. This is the number on the front of the datasheet.
- Breaking capacity
- What it can safely interrupt. Usually a much lower number, and often on a different page.
The two get confused constantly, and only the second one helps you in a fault.
Breaking capacity is the component number that gets forgotten
A fuse or contactor's rated voltage is not the same thing as its breaking capacity. A DC circuit has no zero crossing to extinguish an arc, so breaking capacity has to be designed into the component. An under-rated fuse doesn't extinguish the arc, it sustains it — it is the single component that turns a fault into a fire.
Before you order
Build a list of every HV component with both its working voltage and its breaking or insulation class: fuses, contactors, connectors, cables, the precharge circuit, DC/DC, charger and insulation monitoring. A 500 V-rated part in a 760 V circuit is a common and expensive mistake, and you find out about it during a fault. FIM23HB 50/90
Insulation: two independent barriers
Insulation requirements are usually expressed in ohms per volt and multiplied by system voltage. The level varies between sources, so confirm it against the code that actually applies to you; the difference can be five-fold, and it sizes the whole insulation structure.
Structurally the principle is the same whatever the level: two independent barriers between live parts and the chassis, each sufficient on its own. And a third requirement that is easy to skip past: insulation monitoring has to open the contactors, not just log a fault code.
Our case an open conflict, kept open CC §07FIM23HB 00
The project's own material carries two different numbers for this: the cooling document sizes at 500 Ω/V (378 kΩ at 756 V) while the sporting code's material says ≥ 100 Ω/V (75.6 kΩ). A five-fold difference, recorded as an open conflict rather than quietly resolved in favour of one of them. It is included here because the right handling of a conflicting requirement is to mark it, not to pick; somebody downstream is using the other number.
The high-voltage system, drawn before it is bought
The components above only make a safe system if they are connected in the right order and switched in the right sequence, and both can be drawn on one page before anything is ordered. The architecture is the same on almost every electric race machine; what differs is the part numbers.
The switching sequence is part of the design, and it is worth writing down as a short list of states, because every fault the system can have is a question about which state it is in:
- Off. Both contactors open, the bus discharged. The 12 V system runs from its own battery, the BMS checks the cells, and the insulation monitor checks the pack against the chassis before anything else is allowed.
- Precharge. The negative contactor and the precharge relay close, and the inverter's capacitors charge through the resistor. Closing the main contactor straight onto an empty capacitor bank welds contacts; the precharge exists to prevent that, and the controller waits until the bus voltage is close to the pack's before moving on. A precharge that never completes is a fault, not a delay.
- Ready. The main positive contactor closes and the precharge relay opens. The bus is live, drive is not enabled, and the lights say so.
- Drive. Drive is enabled by a deliberate action, and the lights change to a signal that is different from both "ready" and "fault".
- Fault or stop. Any break in the safety loop, an emergency stop or the lanyard pulling out, opens the contactors, and the bus is actively discharged. The FIM guideline asks for the bus to fall below 60 V within five seconds of the general circuit breaker opening, for both poles to be isolated, and for a rider cut-out on a lanyard that is separate from the emergency stop FIM23.
Two items in the figure are worth a word because they are easy to leave out. The interlock loop (HVIL) is a low-voltage circuit threaded through every high-voltage connector, so that unplugging one drops the contactors before the connector can be opened live. The FIM guideline does not require it; production electric vehicles use it as standard, and on a machine that is taken apart between sessions by students it is cheap insurance. And the status lights are for the marshal, the mechanic and the visitor rather than the rider, which is why the guideline wants them on both sides of the bike and visible from ten metres FIM23.
Our case Mk1 already logged its stop circuit HISTHB 50/90
Mk1's logger recorded the emergency button and the lanyard as channels of their own in 2022, so its sessions in the archive show whether the stop circuit was made. That is the right habit: a safety function whose state is logged can be checked after the fact, and one that is not can only be assumed. For Mk4 the architecture above is the intent; the component list with voltage and breaking ratings is the open item that comes before any of it is ordered.
Design it to be testable
A self-built pack typically needs test evidence for overcharge, overvoltage, over-temperature, spray and drop. These are far easier to pass if the structure was designed for them from the start than if the pack was first made to work and then made testable. The same goes for the vent path: when a cell vents, the gas has to be routed out somewhere that doesn't point at the rider, the rest of the pack or the inverter, and that is a volume allocation, which has to happen before the module height is locked.
Our case Imatra 2022 · the test that is not on the list DIARYRACE22
The bike that won the 2022 race crashed on the final straight of it. The rear wheel locked at about 260 km/h, the machine slid two hundred metres down the asphalt and was destroyed along one side; the rider got up unhurt, changed his leathers and started the next race an hour later. Helping to collect the pieces, the project's own note on the winning bike's pack was that it "wasn't packed too well to handle any kind of crashing".
Overcharge, overvoltage, over-temperature, spray and drop are the tests a pack has to pass. A slide down a straight is the one it actually has to survive, and it is not among them: a drop test is a fall onto a flat floor, not an abrasion at racing speed with the machine on its side and the outboard face doing the grinding. The design consequences are cheap early and unavailable afterwards: which face of the pack is outboard, what sits between the cells and that face, and whether a marshal who has never seen the bike can tell from the outside whether the pack has been breached. None of that can be added once the enclosure is machined, and no certification test will ask you for it.
Our case Mk4 · warning lights by choice LOG 16 Sep 2026FIM23
Warning lights and HV markings were adopted for safety reasons, not for scrutineering. The argument is simple: the thing gets looked at and touched by people who don't know what is inside it. Because the bike is a demonstrator and teaching platform as much as a race machine, the sporting code is more than a scrutineering threshold: it is the best available design guide, including on the days no scrutineer will look. Some of it was kept binding by choice: markings, breaking capacity, and electrical work safety, the last because as university equipment the bike falls under workplace safety law regardless of what any sporting code says.
Who is allowed to ride it is a decision, and it is made in advance
A university prototype that does 240 km/h eventually needs somebody to sit on it, and the question of who is not an administrative afterthought. It belongs with breaking capacity and vent paths: cheap to settle months early, and impossible to settle at the moment it matters — which is a booked airfield, a loaded van and eight people already standing on the runway.
Two things want separating, because they fail differently. One is competence: a current competition licence, recent time at speed, and machinery of comparable performance in the rider's own history. The other is the capacity in which the person is riding: an institution's own student or employee riding institutional equipment is a different arrangement from a licensed racer riding on their own competition licence, and it is worth settling which applies before the day rather than on it.
Our case a test rider's account of himself, in writing, before the ride RIDER
Before the airfield runs, the project's reserve rider set out his qualification in writing: his racing season and machinery, a current competition licence, his road-licence categories and his track experience, and the capacity in which he was taking part.
No policy had to be drafted to produce that. Somebody asked, and a rider who had raced answered in the terms racing uses. What makes it worth anything is that it is dated before the ride; the identical sentences, written the week after an incident, would be worth nothing at all.
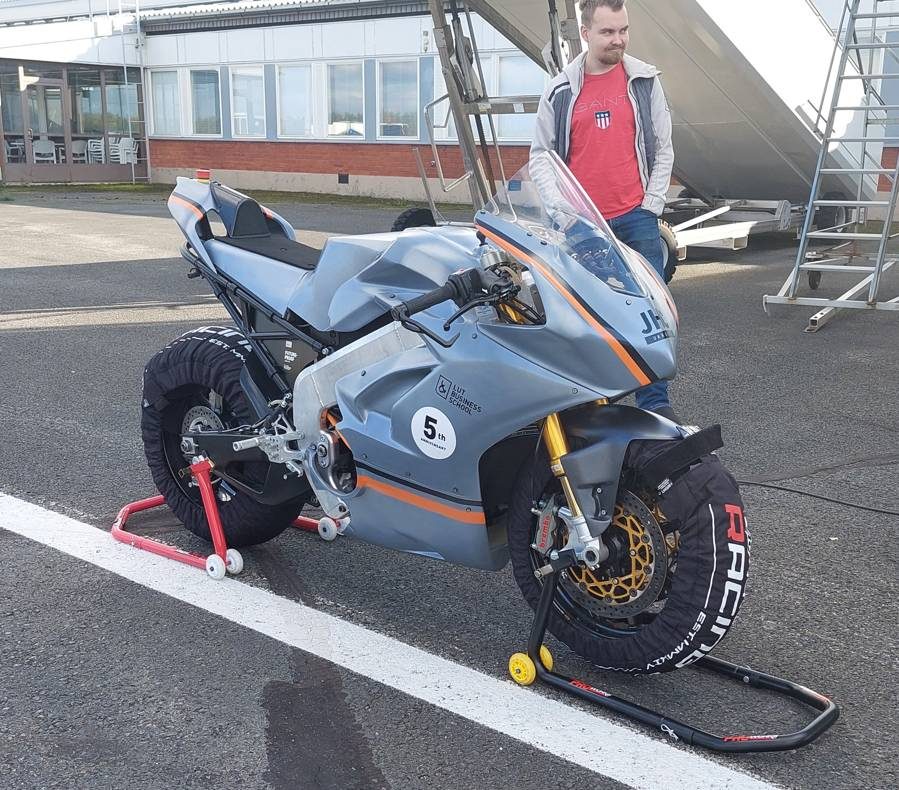
Race-day operations are part of the design
Four things decide whether a ride day is one session or a full day, and none of them shows up in lap time: where the bike charges, what is in the paddock, what sets the schedule, and where the heat goes between sessions.
The first is charging where you actually ride. The bike can be finished and still be a one-session machine if there is nothing to charge it from. Work out the numbers early (energy per session, the voltage the pack charges at, and the power you need to turn it around between sessions), because they decide whether you need a portable unit, a fixed installation, or an arrangement with someone who builds them. A street circuit has no infrastructure to fall back on, which makes portability a design requirement rather than a convenience KEMP. For scale: the MotoE bike charges through a 20 kW socket from an external charger and takes about 45 minutes to 80 % DUCATI, which is roughly the turnaround a race weekend schedule gives you.
The second is the paddock itself. The PPE and equipment list for a high-voltage bike is short, cheap and much easier to buy in advance than during a race weekend: class 0 insulating gloves, insulating mat, a rescue hook, a voltage tester, a CO₂ extinguisher for the HV system and a lithium-rated extinguisher for the pack FIM24. Event organisers' guidance covers paddock operations in more practical detail than the technical codes do, and it is worth reading even from the wrong discipline MSUK. For the risk assessment itself (hazard mechanisms, firefighting and what the authorities expect), a national safety-authority report is a better starting point than a sporting code GAIA.
The third is the schedule, and what actually sets it was learned at a first race weekend. Tyre warmers set it, not the charger. Getting slicks to temperature takes close to an hour, which on a test day is the real interval between runs and on a race day is what every other preparation has to fit around; an electric bike's turnaround is rarely the thing that binds. And the connection between your charger and the local supply is a part you should own, in advance, and have plugged in once. The project's first race weekend included an emergency drive to a hardware shop for a three-phase cable at nearly €300 (which turned out not to be needed, and was promptly lent to the race office, which did not have one either) and then a Saturday morning on which the bike simply would not begin charging. That is a trivial fault on a bench and an expensive one at eight o'clock before qualifying. DIARY
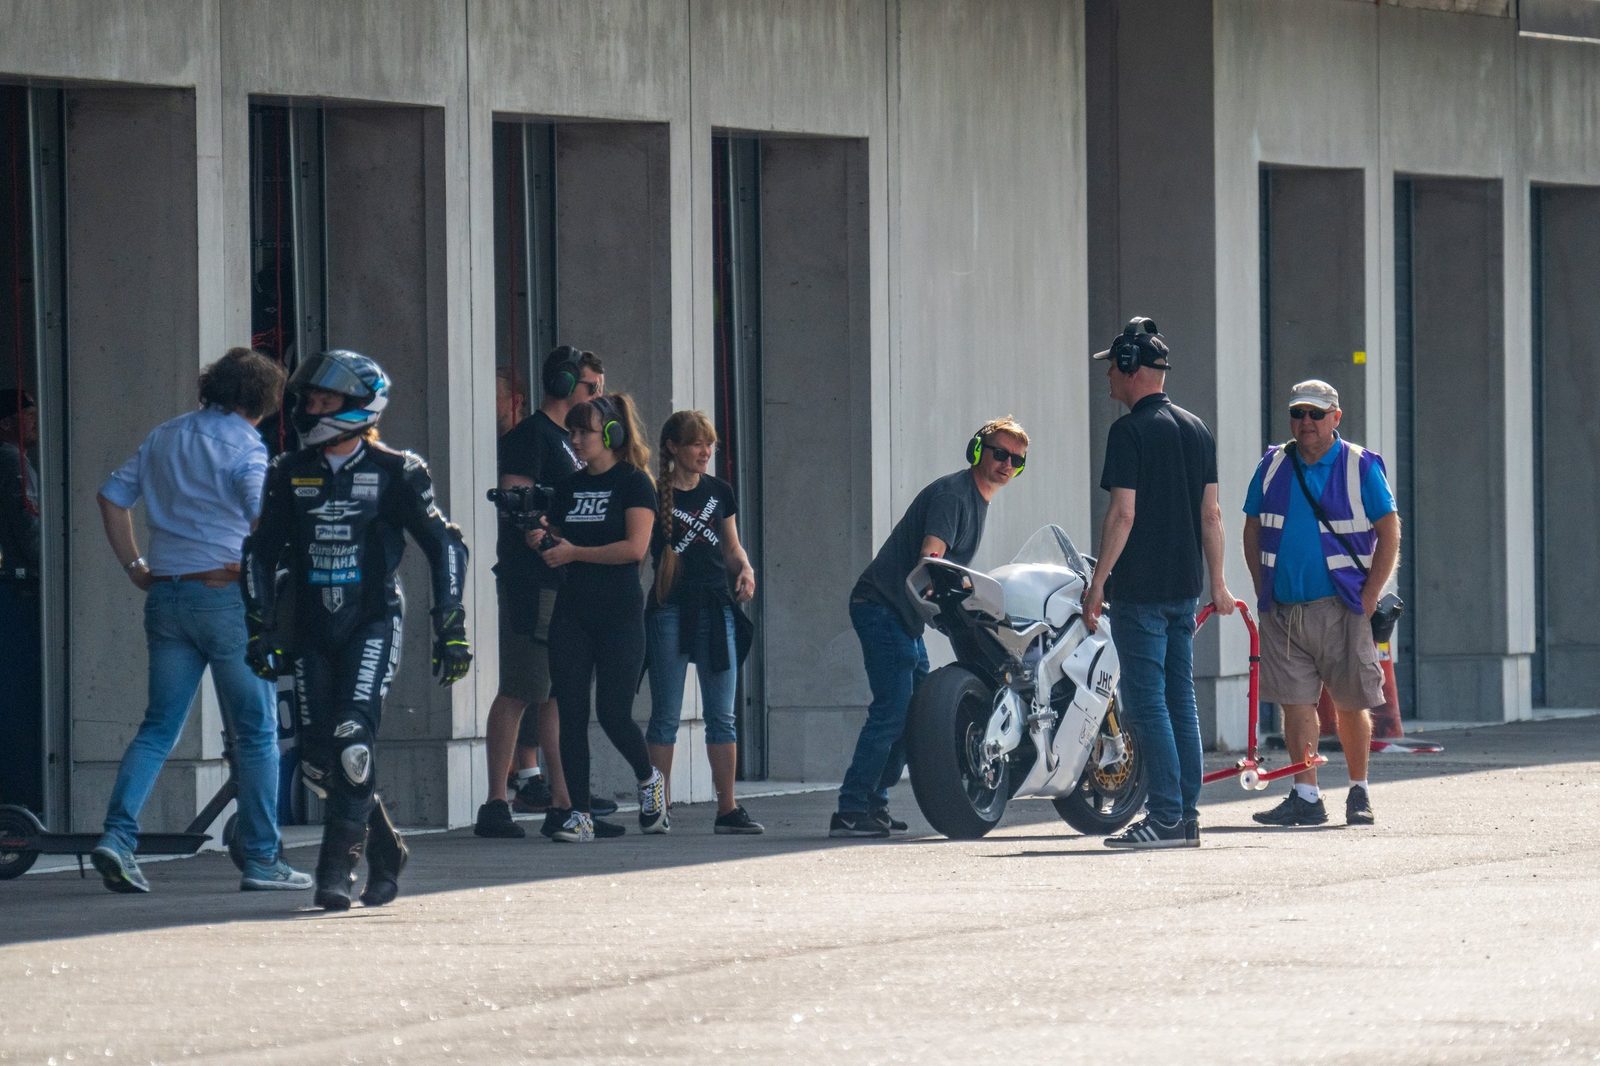
The fourth is where the heat goes between sessions, and it is larger than it looks, because paddock time is five things at once: charging time, cooling time, maintenance time, data-download time and preparation time for the next session. And a hot pack is not necessarily ready to accept charge the moment the bike stops, so the first two are in series before they are in parallel. If the pack's passive time constant is hours, it starts the next session warm unless something cools it in the paddock. On Mk2 and Mk3 that something was a cordless leaf blower with a home-made nozzle, blowing air straight through the pack, which is the kind of improvisation that works and never gets written down. Mk4's liquid circuit makes the proper version possible: cold water through the pack while it charges and while it waits.
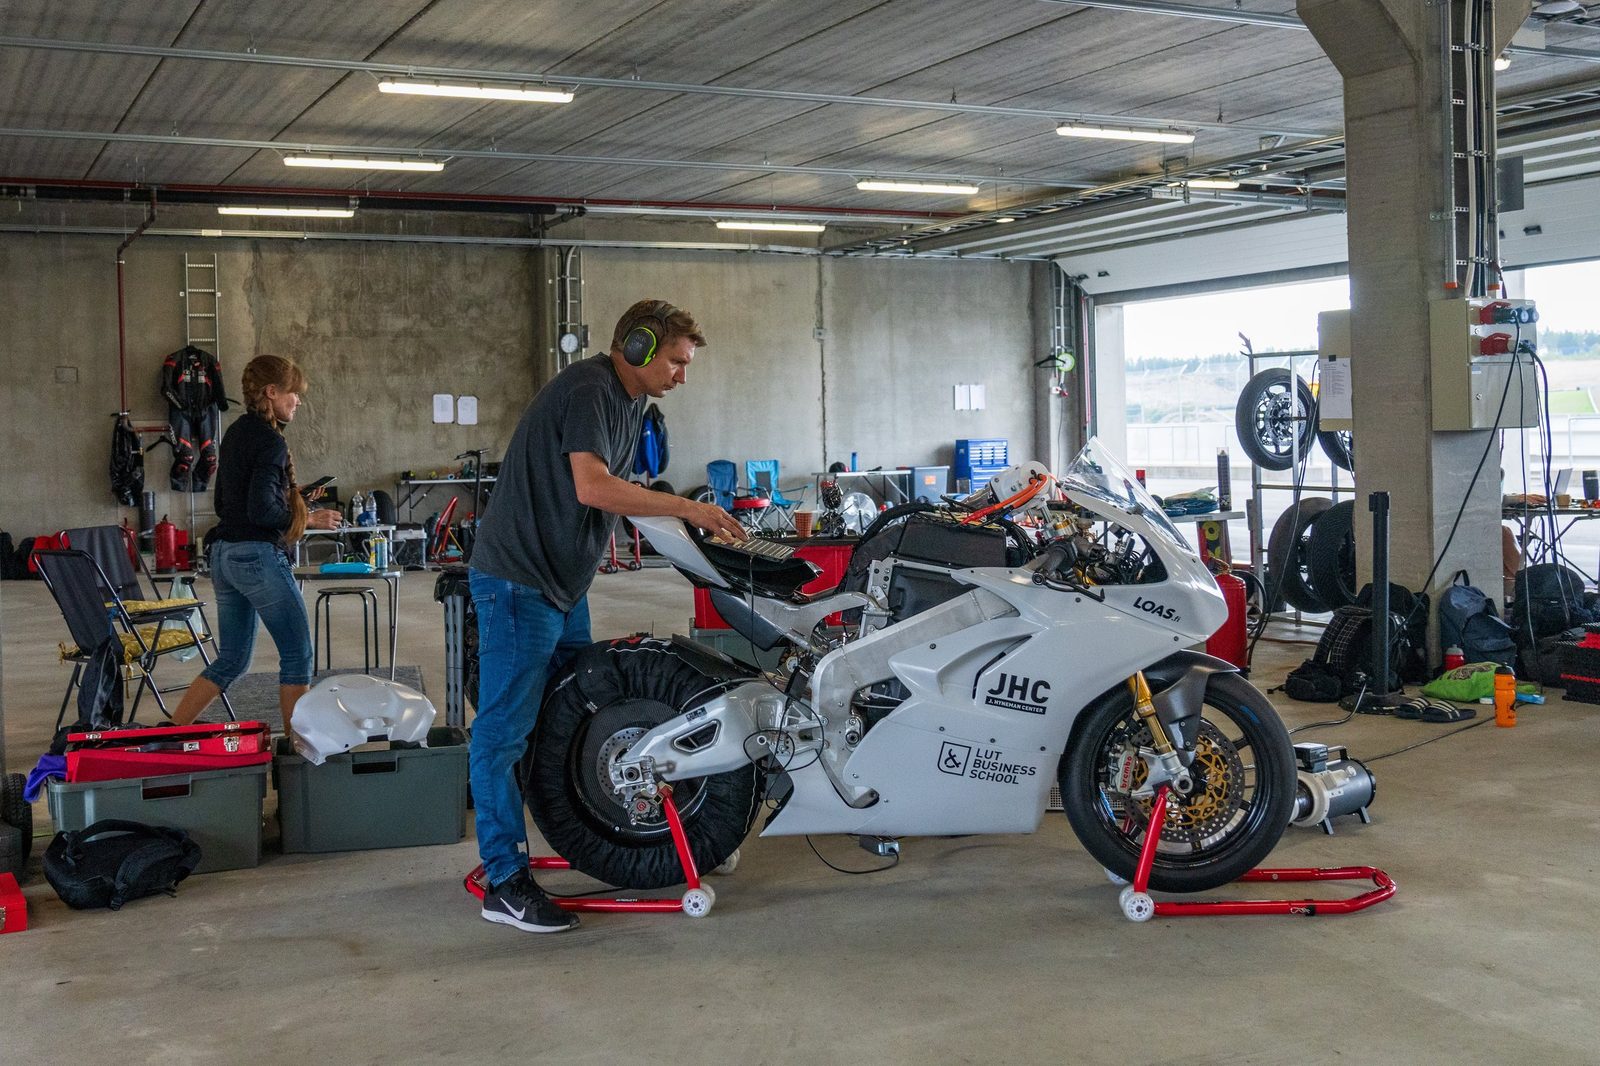
Our case an idea on the shelf · charge and cool through the same connector EMRC
High-power DC charging cables are already liquid-cooled KEMPLC; the coolant stops at the connector. The project drafted, and never submitted, a research proposal to carry it one step further for racing use: an externally coupled cooling loop that connects to the bike's closed battery circuit through a quick-connect at the charging point, via a liquid-to-liquid heat exchanger, so that a pit-stop-length charge at up to 80 kW can be run with far more heat extraction than the onboard system (sized for mass and continuous running, not for a ten-minute event) could ever provide on its own. The draft's argument was that high-power charging in light vehicles is limited by the pack's temperature well before it is limited by the charger, and that the limit is cheapest to move from outside.
It is recorded here as a further-development item rather than a design, because nothing has been built. What it would need is already on this page: a coolant quick-connect designed into the pack, a pack whose cooling channels can take an external flow rate, and a paddock procedure in which charging and cooling are one operation. The question it leaves open is worth a thesis: how much of a race-length charge's heat can be taken out through the connector before the cell's internal gradient, not the coolant, becomes the limit.
Rule
Separate two questions: what is a scrutineering requirement, and what is good design.
When the bike isn't entering a series, the first question disappears while the second remains. A sporting code is still the best checklist available, because it was written by someone with access to accident reports.
Method: how you know it's true
Over three years the biggest single risk is losing track of where a number came from, more than getting a calculation wrong.
This chapter settles how the numbers stay trustworthy. A technical project generates more numbers than one person can hold. When calculations get updated at different times in different files, you get sediment: the same quantity exists as three different numbers and nobody knows which is current. That is the normal consequence of design progressing unevenly rather than carelessness, and the errata page at the back of this book is a worked example of what it looks like when someone goes back and checks.
The chapter runs from the discipline of writing things down, through what to measure and how to judge a result, to the two sources of evidence that are not instruments (the rider and the outside expert), and ends with when to stop deciding.
Four rules that stop the sediment
- Every number has a source. A workbook sheet, a datasheet, a test record or a calculation. If there is no source, mark it an estimate. This is the only mechanism by which somebody three years from now can trust the page.
- One place per number. When a decision changes, rewrite the page and move the old version into the decision log as a line. Pages don't accumulate layers.
- Calculation and readable form are different documents, and one of them wins. The workbook calculates, the handbook explains. In a conflict the workbook is right and the handbook has fallen behind, but that has to be agreed in advance.
- Conflicts get written down, not quietly fixed. When the material contains two different numbers for the same quantity, record it as a finding with both sources. A silent correction destroys the information that the other number is in use somewhere.
Our case what this caught HB 00WB s1/s0-B
A single review of the project folder turned up nineteen conflicts or gaps. Several were mechanical: the same figure appearing as three numbers. Two were not: the physical module division existed in two incompatible versions (5 × 36S6P in the workbook, 12 × 15S6P in the cooling document), and a dimensional correction had been applied to one drawing but not to the parts list or the other drawings. Both would have been discovered by machining the wrong tooling.
A later check found one more of the same kind, and it had already propagated: the workbook's summary sheet carries a cumulative lap-time step as if it were the mass item alone, the project handbook copied it, and an early draft of this book charted it before a cross-check caught it (open item O1). Three documents, one wrong number, all agreeing with each other — which is exactly why rule four says both sources. They were found because someone wrote down where each number came from and the sources disagreed.
Three registers
In practice this means three lists, kept separate from the subsystem descriptions:
| Register | Answers | The field that matters |
|---|---|---|
| Locked choices | What is no longer reopened by discussion | What reopening costs; without it the lock doesn't hold |
| Decision log | What changed, when and why | Abandoned paths with their reasoning |
| Open questions | What gets resolved next | What this blocks; that is what produces the critical path |
The answer is often already in the data
The rules above are about keeping numbers findable. There is a second reason to keep them, and it is the one that pays: a question you ask in year four is often answered by a log from year one. Logs are cheap to keep and impossible to recreate, and the value of an archive is not what you thought you were recording; it is what somebody later thinks to ask of it.
Our case the proof was in the archive from the first season HISTWB s9
The voltage diagnosis that justifies this project's largest single decision, the move to 180S, was argued in 2026 from a 2024 session. The same conclusion is in logs from 2022, on the first bike, with a different pack and a different manufacturer's inverter; chapter 06 has the data. The team had known the direction since that first season, and what held the change back was funding, not knowledge. What the archive added, once somebody went back to it, was proof on independent hardware, which is what turns a known direction into a decision that can be defended. The logs cost nothing to keep and would have cost a season to recreate.
The same archive answered a second question that had never been asked: three generations of lateral-acceleration data, all from the same logger and channel, plotted against each other for the first time in chapter 01.
Three ways a measurement can be worthless, all of them cheap to prevent
The archive also showed how data goes bad, and the failures are worth naming because each is a two-minute check that nobody did.
Our case three faults in the early archive HISTDECK
A number that was published and wrong — but only half of it. The project's presentations state 262 hp and 856 Nm at the rear wheel, from a roller dyno in 2022, alongside a top speed of over 240 km/h. The speed is right: the airfield logs give 240.4 km/h. The power is not: the peak electrical input to the motor, pack voltage times pack current, was about 100 kW, roughly 135 hp, and what reaches the wheel is necessarily less. The torque figure is plausible: 856 Nm at the wheel is 462 Nm at the motor through the ratio of the day, which is within the motor's range. So the likely fault is specific and locatable: the dyno's speed or rpm channel was set up wrong, and power is torque times speed. A right number and a wrong number were multiplied together and the result was put on a slide, where it stayed for four years. That is also why the error survived: it travelled next to a speed figure that was correct and independently verifiable, so anyone checking one of the two claims would have found it sound.
A sensor nobody calibrated. On Mk1 the logger's own lateral-acceleration channel peaks at 0.4–0.5 g while the GPS-derived one on the same laps says 0.9–1.0. On Mk3 the two agree. The inertial unit was never calibrated, and because nothing depended on it at the time, nothing revealed it. Having two independent measurements of the same quantity is what caught it — years later, and only because both were still there.
A session with no lap times at all. The Mk2 test at Motopark in October 2023 has full telemetry and no timing: the beacon was not configured, so every file records one "lap" the length of the whole session. The generation's lap times do not exist and cannot be recovered. The bike ran, the data was logged, and the one number everyone would later want was the one not captured.
Rule
Before a test day, check the three things that make the day worthless: the trigger, the calibration, and a second opinion.
Is lap timing actually armed? Has every derived channel been calibrated against something? And is there a second, independent measurement of anything that matters: GPS against an accelerometer, an inverter's current against a clamp? Each is minutes. Each has cost this project a season's data at least once.
Measure what you can't reconstruct later
Bench and track time is always short, so measurements need prioritising. A good test is simple: what can't be reconstructed afterwards by calculation? Thermal time constants, the temperature dependence of resistance, and how a limiter actually behaves all disappear unless they are logged under load. Efficiency maps and driveline losses can be estimated, less accurately, on paper.
One logging requirement applies to everything: all sources on one timebase, from one common trigger, at 10 Hz or better: the inverter's currents, voltages and temperatures, every cell voltage and thermistor from the BMS, and torque and speed from the bench DYNO. If those don't share timestamps you can't compute resistance or efficiency afterwards and you can't repeat the run comparably. It is the one place where carelessness invalidates the whole session.
And one requirement applies to every lap time this project ever records, because chapter 01 showed how little a bare figure means. Log the context of the lap, not only the lap. At minimum, chapter 01's five variables with the map in use added and the lap's place in the session made explicit: state of charge at the start of the lap; pack, motor and inverter temperatures at the start; the power or torque map in use; the tyre type and its history (new, and how many laps if not); the lap's position in the session; and whether the session was a single flying lap, a race-distance simulation or a settings test. Six fields, written on the same line as the time. Without them a lap time is not comparable with another lap on the same bike a week later, and the project has three years of times that cannot now be told apart on any of the six.
A requirement list is what makes "did it work" answerable
The registers above record what was decided. A requirement list records what was asked for, and it is the only document that lets anyone judge the result without re-arguing the design. Two details make it work: each line is marked as a requirement or a wish, so that missing a wish is not a failure; and each line carries the date it was added, which is how a later reader tells a stable target from a moving one. At the end you walk the list and name only the lines that did not come true. That is the whole evaluation.
Two habits sit next to it, and both come from the same failure mode: the document says one thing and the workshop did another.
- Record substitutions where the choice was made. The next reader will assume the specified part is the part that exists.
- Treat generated files as their own artefact. A drawing that is correct can still produce a toolpath that is not. Anything derived from a model (DXF, toolpath, weld path, BOM export) needs a check of its own, because it is what the machine actually obeys.
Our case a student project that closed its own list HUSU
The 2025 cooling thesis carried 22 requirements and wishes, dated, and closed against them explicitly: two could not be verified because the build stalled before measurement, one was not met, one, a deadline, is noted as something that should have been a wish rather than a requirement. That is a more useful closing report than a claim of success, and it took a paragraph.
It also produced both habits above the hard way. The cold plate was specified in 6063-T6 for its conductivity and strength, and built in 1000-series aluminium because 6000-series was not available at the time, so the pressing process is proven on the softer alloy only, and that caveat exists because it was written down. And the laser weld path, generated automatically from a DXF whose outline was slightly larger than the part, acquired spurious start and stop points that did not quite meet: one leak, from a drawing that was correct.
One number from the same document is worth keeping for scale. Of €572 of materials, cells and BMS were €530. The entire structure and cooling solution cost €42. In a pack, mechanical design is nearly free and the decisions it constrains are not.
The rider is an instrument, and the readings need writing down
A race bike carries one sensor that is on no wiring loom, samples continuously, and reports in sentences. It is also the only one that can say what the machine is like to use. The difficulty is that its output arrives as opinion, in a paddock, between sessions, and almost never reaches the place where the telemetry is kept.
Two habits make it usable. The first is to write the rider's words down verbatim, and separately from your reading of them — the same register discipline as the rest of this chapter. A rider reports symptoms accurately and attributes causes no better than anyone else: the sentence is evidence, the cause is yours to find. The second is to ask a question that has an answer. "How did it feel?" produces politeness. A question with a number in it produces data.
Our case Mk1 · what the rider said, and when the project understood it DIARY
Four reports from the 2022 test days, written down at the time by a non-engineer with a notebook:
- "It feels like driving all too long in too high a gear." The gearing complaint, in the one sentence a rider can be certain of. The team's own summary that evening was "reduce the gearing to get faster acceleration". Chapters 05 and 06 spend several pages reaching the same place by calculation.
- "More engine brake." Said after the first test, repeated after the second, repeated again at the airfield. That is chapter 10's regeneration floor, stated three times by the only person it affects, long before it was written down as a requirement.
- "There is still a delay." Reported on the bike's first laps. The torque rate limit turned out to be set roughly twenty times too low, which an outside reviewer spotted in a screenshot that October.
- "15 to 20 mm of front shock travel is left unused." Not a feeling at all. A rider who hands you a figure in millimetres has done a measurement for you, and it is the cheapest one on the bike.
And one question, asked by the rider's mechanic before the first lap the machine ever turned: "Try to calculate how many times you are looking for a gear during a round." It sounds like a joke about an electric motorcycle. It is a designed test with a numeric answer, aimed at a specific worry: whether a professional's trained reflexes would fight a machine with no gearbox. The answer after the session was none, and the worry was closed in one line. That is what a well-formed question to a rider looks like, and it came from somebody who had never seen an electric bike before that morning.
Our case Mk3 · a rider's requests, a setup change, and the lap this book is built on AiMLOGTEAM
The clearest version of the same thing happened on Mk3, and it took one session. Riding the bike at KymiRing for the first time in July 2024, the rider went through its handling and asked for specific setup changes, among them both ends 10 mm lower. That is a figure, not an impression: a ride-height change, which moves the centre of gravity and the lean clearance together, both of which chapter 09 has to budget for. The changes were made. At the next outing at the same circuit, in August, the bike's clean lap came to 2:00.50 (the logged 2:02.588 less traffic, chapter 02) — the lap every prediction in this book is calibrated against.
The same first ride produced a second request, and it is chapter 10's regeneration floor seen from the saddle. Mk3 had almost no engine braking, and the rider was making up for it with the rear brake. He asked for the rear brake to be moved from the right foot pedal to a lever on the left handlebar, the hand that has nothing to do on a machine with no clutch. His reason was precise: in a corner the feet are busy with balance and with weighting the bike, so the right foot could not brake with the same freedom, while a hand could add the missing retardation mid-corner. The team bought a left-hand rear-brake lever and fitted it before the August session. That is a rider designing around a missing setting, and it reads two ways at once: as a sound workaround, and as a measurement that regeneration was missing. The workaround went on the lever; the fix belongs in the inverter's regen map. TEAM
What that does and does not prove is worth being exact about, because the temptation is to bank it as two seconds of suspension. The second session was also the rider's second time on the machine, on a circuit he now knew, with the new brake lever and whatever else had been changed in between. The gain cannot be attributed and this book does not attribute it. What the case does show is the mechanism working end to end: a rider turned a handling complaint into a number, the number turned into a change a mechanic could make, and the result arrived as lap time. Most of the 2022 reports took months or years to act on. This one took about four weeks, and the difference was that it arrived with a millimetre figure attached.
Rule
Write the rider's sentences down verbatim, the same day, in the same file as the telemetry.
Then treat each one as an open item with a cause to be found, not as a request to be actioned, and not as an opinion to be agreed with. A complaint that recurs across three test days is a requirement the design is missing.
Getting an expert to look, and what happens to what they say
A student project can get expert attention more easily than it expects. People who have spent careers on a problem are often willing to look at somebody else's version of it, and one introduction from someone they trust is usually all it takes. That part is cheap.
What is not cheap is doing something with the answer, and this is where a review goes to waste. Expert feedback arrives as a flat list: eight or ten observations in the order they occurred to the writer, none marked as more important than the others, most of them small. The reader triages by apparent effort (the easy ones get done), and the item that would have changed everything looks the same size as the rest.
The fix is a different triage question. Not which of these can I do this week, but: which of these, if true, would mean a measurement I already trust is wrong? That question sorts the list in a completely different order, and it is the only order that matters.
Our case Mk1 · the review we did not act on REVIEW22CMS
In October 2022, through the centre's Professor of Practice, Jamie Hyneman, and his contacts, the project's settings and logs were reviewed by an experienced motor engineer in the electric-motorcycle industry. The review was free, generous and specific. It contained, among other things, four items this handbook has since arrived at on its own (the first two the hard way, on the machine):
- The sign convention was wrong. Met again a year later at an airfield, at the cost of a test day (chapter 10).
- Position-sensor latency needed calibrating as well as amplitude and offset. Found a year later as a regen spike (chapter 10).
- The modulation-index test (if it does not reach about 95 % at full throttle above base speed, something is limiting you), which is the exact diagnostic this book now uses in chapter 06 to explain a top speed.
- A rider complaint had a settings cause: the torque rate limit, about twenty times too low (the rider section above).
None of that was ignored out of carelessness. It arrived mid-rebuild, as one email among many, in a list where the sign convention sat between a remark about a parameter that was obviously a typo and a suggestion about saturation percentages. Nothing in the message said “this one invalidates your dyno data”. Nothing in an expert's email ever does, because they do not know which of their observations is the one you cannot see.
Our case the other thing the review said, which nobody wanted to hear REVIEW22
Asked how much work tuning an inverter of this kind actually is, the answer was hundreds of hours on a motorcycle chassis dyno, and that a machine of this power needs a dyno large enough to hold the acceleration down long enough to observe the peak-power region at all REVIEW22. The project had no dyno, rented time elsewhere, and ran out of testing before the race. The shortfall came from a cost that had never been estimated, and effort was not what was missing. If a component's performance has to be tuned rather than specified, the tuning is a line in the plan with hundreds of hours against it, or the component is the wrong one.
What the project did with that estimate is the useful part: it bought its own dyno. Mk3's performance and, more to the point, its reliability owe a great deal to it. At a circuit, working through settings and catching faults is far harder than it sounds, because the same people are simultaneously running tyre warmers, charging, timing, a rider and a schedule; on a dyno the machine is the only thing happening. The expert's comments themselves were largely lost in the volume of detail the team had to work through just to make the next version of the bike run at all, and some of what they said only became legible after the project had made the same mistakes itself. None of this argues against asking; it is a reminder that a review lands on a team at the limit of its bandwidth, and that the lessons that stick are mostly the ones paid for; the review's job is to make the bill smaller, not to replace it.
Rule
Write an expert's review into the open-questions register, item by item, the day it arrives.
Not into an inbox and not into a summary. Each observation becomes a line with an owner and a disposition: done, rejected with a reason, or open. An item that is rejected with a reason is fine; an item that is never written down is the one you meet again in eighteen months, at a circuit, with a stopwatch running.
Lock late, but lock
Locked choices are necessary, because CAD can't start from moving inputs. But locking before the first measurement is a mistake whose price is a whole production batch. The practical compromise: lock the architecture early and the dimensions only after the first measured part.
Our case Mk4 · what is locked and what is deliberately not CC §02HB 40
The cooling channel's structure is locked: three sheet parts, one tool pair, a specified interface material and adhesive. But the row pitch — whether a channel goes in every second gap or every gap — must not be locked into CAD before the first module is measured on the bench, because the estimated heat transfer is a range of 0.25…0.52 W/K. The average cell meets chapter 08's 0.187 W/K anywhere in that range, but the limit applies to the hottest cell, which runs 8–12 K above the average once the coolant has warmed along the pack; at the bad end of the range that cell reaches 60–64 °C, on or over the limit. Those figures predate the cooling document's own correction of the contact area, which moves the range about 15 % lower and makes the bad end worse (chapter 08). The fallback is known and priced: a channel in every gap roughly doubles the heat transfer and costs 6 kg.
Rule
Every locked choice needs a field saying what reopening costs.
Without it, a lock is a wish. With it, the conversation changes: the question is no longer whether the alternative is better, but whether it is better enough to be worth three months of redesign.
Where this goes next
How the project actually runs, what this document is for, the problem it is trying to solve (which is not a technical one), the people who kept it going, and a last word.
Work continues at the J. Hyneman Center with Mk4, as one platform project among several. That phrasing is deliberate and it sets the pace: this is not a motorcycle programme, it is a teaching workshop that happens to build a motorcycle, and the bike advances in the gaps between course assignments, theses and everything else the centre does. It will not move as fast as it would somewhere that builds motorcycles and nothing else, and it is not meant to.
Nor does it run the way a student project is usually pictured. There is no year group that arrives in September, builds a bike and hands it over in spring. Students join when a course, a thesis or an assistant's post brings them in and leave when it is done, so at any moment the team is a mix of people in their first week and people in their last. The bike changes the same way. It is never rebuilt for the sake of a new group: what gets redesigned is the part expected to give the most lap time for the effort, or to make the machine safer, and everything else is carried over. Mk1 to Mk4 are the states of one machine at the points where enough had changed to give it a new name. TEAM
What the platform is supposed to do is produce topics. Each subsystem in this book is a thesis or a course project waiting for someone: the cold plate was one, the air-cooling review was another, the interconnect study a third, and chapters 05 through 11 are full of open items that are the right size for a student and that have a real machine at the end of them. That is the point of the platform, and it is why a bike that is never finished is a feature and not a weakness.
Around the theses there has also been a steady stream of smaller exercises, many of them from the machine design course: one version of the rear subframe was designed that way, and so was the steering-head bearing arrangement. Some of that work went onto the bike as it was, some after modification, and some was set aside. That is ordinary design work, and it would be no different with a team of full-time professionals: some of the ideas and designs always end up rejected. Nor has the work come only from mechanical engineering: visual artists, business school students, electrical engineering students and even a practical nurse have taken part, to name a few. TEAM
The problem this document exists to solve
It is also, though, exactly where student projects fail — and the failure is almost never technical. A student finishes, and what they knew leaves with them. In a project where people come and go all year there is not even a handover day: nobody is ever formally handed the project, so nothing is ever formally handed over. Whoever joins next inherits hardware they did not design, settings nobody can explain, and a folder of files with no index, and spends their first months rediscovering things that were known two years earlier. This project has done that more than once, and this book is a record of it: a voltage fix that was known from a 2022 log and waited four years for the money to make it; an expert review, two of whose findings were later met again the hard way; a published power figure that was wrong for four years because it travelled next to a speed figure that was right (chapter 12).
That is what this handbook is for. Not to be right: the errata page is where its mistakes will be recorded, and there will be some. To be the one place where the project's numbers, decisions and mistakes are written down together, with a source against each, so that whoever joins next starts from where the last person finished rather than from where the project began. A handbook that is updated and occasionally corrected is worth more than a report that was accurate once.
Every convention in chapter 12 exists for that reason, and they are worth restating as the thing to take away if nothing else is: every number carries a source; a decision that is reversed is logged with its reason; a question that is open is written down as open; and a correction is published rather than quietly applied. None of it requires software, a budget or anyone's permission. All of it requires somebody to decide that the next person to join matters as much as the people already here.
Rule
Write it down for the person who has not arrived yet.
They are the only readers who cannot ask you what you meant, and in a project that students join and leave all year they are also the majority of your readers. Everything this book got wrong, it got wrong because somebody in 2022 knew something and had nowhere to put it.
The people who kept it going
First the riders, because every measured number in this book exists because one of them went and got it.
Our case the cheapest thing we bought was a rider LUTRIDERHIST
Three people have ridden this bike, and none of them rode it as a student of the university — which turned out to matter more than any component.
Pauli Pekkanen rode Mk1. Thirteen years of racing, seven of them in Britain, including the Superstock World Championship; back on the grid from 2016 for Imatranajo specifically, where he is one of the meeting's home stars with three wins, two seconds and two thirds UUTIS, and where in 2023 he won all three of his starts in the IRRC (International Road Racing Championship) Supersport and Open Supersport classes BIKEPP. He rode a university prototype nobody had ever ridden, in 2022, on its first day out.
Eemeli Lahti has ridden Mk2 and Mk3. He started in Aki Ajo's academy on a 100 cc Honda in 2007 and won the Finnish MiniGP cup the following year; took a national bronze in 125s; then raced 600s in the European and world championships and in the British series, where he scored a win and several podiums, and took European Superstock 600 silver in 2016. ESS A few weeks after riding Mk3 he rode the 2024 Bol d'Or 24-hour at Paul Ricard for TRT27 AZ Moto and finished third in the Superstock class BIKEBOL.
Two weeks after riding Mk3 at KymiRing in August 2024 he was crowned Finnish Superbike champion, with four wins from the season's six races ESS; chapter 02 says why that matters to the model.
Jere Honkanen was the reserve, because a race rider is not always available when a test day is: a licensed national-class road racer kept on call for specific test duties, who rode part of the airfield straight-line testing on Mk1 and Mk2, with Pauli taking the rest. Chapter 11 comes back to how a rider's qualification is settled before a test day.
They brought lap time, and that has to be said first, because a handbook written by engineers is prone to treating the rider as a boundary condition. A rider of this level finds the machine's real limit rather than a cautious estimate of it, finds it on the first day rather than the tenth, and — the part that actually matters for a development project — tells you which limit he found. Every measured number in this book is a number somebody was brave enough to go and get.
What they and their mechanics added on top of that was everything around the lap: which tyres, how to get heat into them, what a test day's running order should be, what to check between sessions, how a race weekend actually works. The clearest case is not a rider at all. Markku Saarinen, Pauli's chief mechanic, is the reason the project's first session on a rented chassis dyno happened: it is doubtful anyone on the team would have dared sit on the bike without him there. He has been Pauli's chief mechanic since 2010, when he took two years' sabbatical from his day job to follow him to the British championship, and he is the man who in 2018 built a complete race bike out of parts gathered from around Finland in three days, after Pauli's engine died a week before Imatranajo; Pauli then took pole and the win, and a lap record. He also lent the project components so that design work could continue while its own parts were in the post. Pauli's own summary of working with him is the best description of what an experienced mechanic is worth to a student team: “as long as you believe what Markku says, everything goes well”. UUTIS
A student team can derive a powertrain from first principles. It cannot derive paddock practice, and trying to costs a season. Budget for an experienced rider and an experienced mechanic before you budget for a part; the learning curve you skip is steeper than the one you can see.
If students come and go, the continuity has to come from somewhere, and in this project it has come from the J. Hyneman Center's staff. That the project has had funding, has survived the gaps between one set of students and the next, and has actually reached a track is largely their work, together with a close partner elsewhere at LUT, and it is right to end with them. TEAM
- Terhi Virkki-Hatakka carried much of the project's documentation and communication (including most of the project diary), along with photography and the general arrangements around events.
- Markku Ikävalko has acted as the project's general manager: relations with race organisers and circuits, the transport to events, and hands-on work in the workshop, the fairings among it.
- Petri Tuhkanen did the electrical design and installation, a good deal of the mechanical installation work besides, and has had an important role at the track.
- Jamie Hyneman, Professor of Practice at LUT, has been there whenever the project needed new ideas or had materials to choose. Through him the project reached expert reviewers, and he made possible the team's visits to the Lightning and Zero Motorcycles factories.
- Marko Kasurinen, who compiled this handbook, has been lead designer and project manager.
- The centre's student assistants of each year have each added their own share, on the bike and around it.
- LUT Voima, the prototype workshop and laboratory of LUT School of Energy Systems, is where the project turns whenever a part is too difficult to make on the centre's own machines. It has made numerous parts that would otherwise have gone to subcontractors; subcontracting works, but it slows every round of iteration and development LUTVOIMA.
Documentation, photography and presenting the bike have been everybody's work, and the last of these matters more than a design handbook would usually admit. Ukkonen has been the J. Hyneman Center's most visible demonstration of what the whole workshop is for: a machine students designed and built, shown to the public several times at the MP Motorcycle Show in Helsinki, Finland's largest motorcycle show, and at many other large events, and sat on by the President of Finland when he visited LUT University in January 2025 PRES. For a project that lives on funding and goodwill, that visibility is part of the result, for LUT and for the centre alike. Count the time spent presenting the bike as project work, not as a distraction from it: nobody can tell in advance which stand conversation turns into a partner or a sponsor.
And then the point of all of it: the students. They have had real topics with a real machine at the end of them, and a place in the design office, in the workshop and in the pit crew at a race meeting. Much of what this book records, they learned first.
A last word
This book is partly a handbook and partly the story of how one team learned its trade. We are not claiming to be at the front of this field, and nothing here should be read that way. It is what we have been through and what we think we know today, written down so that the next people do not have to start from zero.
It is also worth saying where the calculations stop. A lap simulation, a pack sized on paper and a locked list of components are a long way from a motorcycle that works. Between the two lie CAD, electrical design, manufacturing methods, procurement, assembly and testing, and each of those holds more work than the arithmetic that set it up. As this book shows more than once, the first version of anything is the first prototype and a starting point, not an answer. Getting to a good result takes more iterations than anyone plans for, across hundreds if not thousands of details.
We are still on that road. The book will be updated as Mk4 produces results, and those results may show that we were heading in the right direction, or prove us spectacularly wrong. Either way it will be written down here. But the work is what pays you back. There are not many feelings better than watching something you built go past the others on a race track for the first time.
Symbols and recurring terms
Nothing new here — just a place to look up something the book has already defined, without hunting for the chapter that defined it.
| Symbol | Quantity | Unit | Defined in |
|---|---|---|---|
| Kt | Torque constant: torque the motor makes per amp of q-axis current | Nm/Arms | 05 |
| Kv | Speed constant: motor speed per volt with no load | rpm/Vdc | 06 |
| U | Pack voltage. Usually stated loaded, because that is the one that limits | V | 06 |
| G | Overall ratio between motor and rear wheel | — | 05, 09 |
| I | Moment of inertia of a rotating part | kg·m² | 09 |
| h | Heat transfer coefficient, per cell: the cooling requirement | W/K | 08 |
| R | Internal resistance, per cell unless stated | Ω | 07, 08 |
| r | Rolling radius of the rear wheel | m | 05 |
| μ | Coefficient of friction between tyre and track | — | 01 |
| g | Acceleration, as a multiple of gravity. Not grams, which are written out | — | 01 |
| CdA | Drag area: drag coefficient times frontal area | m² | 03 |
| Id, Iq | The two halves of the motor current: d makes no torque and is spent on field weakening, q makes the torque | Arms | 06 |
| Term | What it means here | Defined in |
|---|---|---|
| Base speed | The rpm at which the motor's back-EMF reaches the pack voltage. Below it you have full torque; above it you are buying rpm with field weakening | 06 |
| Field weakening | Using d-axis current to oppose the magnets' flux, so the motor will turn faster than the pack voltage would otherwise allow. The current that does it makes no torque | 06 |
| 180S6P | Pack configuration: groups of 6 cells in parallel, 180 of those groups in series (1 080 cells) | 07 |
| Race pace | Average lap over a race distance, as opposed to a single best lap. Mixing the two is the trap in chapter 01 | 01 |
| Cold plate | A sealed plate with coolant running through it, cooling the cells through one face | 08 |
| Our case | A copper-edged box. Everything inside it is this project's own situation, not general guidance | 00 |
| Course bike | At a road-racing meeting, a machine that goes round the circuit ahead of or between sessions rather than racing; at Imatranajo Ukkonen was to have led the practice sessions this way | — |
| IMD | Insulation monitoring device: measures the insulation resistance between the high-voltage system and the chassis and reports a fault before anyone can touch it | 11 |
| IRRC | International Road Racing Championship, the road-racing series that runs at Imatranajo on closed public roads | — |
| TIM | Thermal interface material: the pad, paste or adhesive layer between a heat source and whatever cools it | 08 |
| Type I insulation | In IEC 60034-18-41, a motor insulation system meant to stay free of partial discharge for its whole service life on inverter supply | 05 |
| VSM mode | Vehicle State Machine mode of a Cascadia inverter: the inverter is controlled through analogue and digital inputs rather than over CAN | 10 |
| Lap beacon | The trigger a data logger uses to split a session into laps: a trackside transmitter, or a GPS finish line set in the logger. Without it, a session is logged as one long "lap" | 12 |
Checklist: the order of work
The book in twenty questions, in roughly the order the answers are needed. Each one locks something that later questions depend on; chapter 04 explains why the order is forced where it is.
| # | Question you need answered | What it locks | Ch. |
|---|---|---|---|
| 1 | What's the metric, and is the circuit grip-limited or power-limited? | All prioritisation | 01 |
| 2 | Is there a measured clean lap to calibrate the model against? | Every value in seconds | 02 |
| 3 | What's the seconds value of each item, including the ones worth nothing? | Work order | 03 |
| 4 | How much torque × rpm does the corner-exit target need? | Motor requirement | 05 |
| 5 | Does the torque already reach the tyre's limit, and if it does, what is the rpm ceiling? | Whether a motor change is worth anything | 05 |
| 6 | What's Kt at operating temperature, measured rather than from a datasheet? | Current requirement, telemetry, torque control | 05 |
| 7 | What is Kv × U at the rpm you want, and is it enough? | Pack voltage | 06 |
| 8 | Which of the three voltage ceilings is lowest: inverter, BMS or insulation? | Series count | 06 |
| 9 | How much energy for a full race, regeneration included? | Lower bound on cell count | 07 |
| 10 | Which face of each cell does cooling use, and does that leave a weldable surface for the interconnect? | Interconnect layout and joining process | 04, 07 |
| 11 | How much does a cell dissipate at race load, on RMS current? | Cooling requirement h | 08 |
| 12 | Is the thermal chain drawn out, and do you know the biggest link? | Where the cooling effort goes | 08 |
| 13 | How is flow distribution between parallel cooling paths guaranteed? | Whether the cooling works at all | 08 |
| 14 | Does the pack fit the frame alongside the motor, in CAD rather than in an estimate? | The whole architecture | 09 |
| 15 | Is there a line-item mass budget with estimates and weighings separated? | Lap time and credibility | 09 |
| 16 | Which way does the motor turn, and does the inverter agree that that way is forwards? | Gyroscopic cancellation, and whether field weakening works at all | 09, 10 |
| 17 | Has the BMS protection been verified by measurement rather than assumed? | Whether protection exists | 10 |
| 18 | Do the HV components have breaking capacity at system voltage? | Safety, procurement | 11 |
| 19 | Has one module been measured before the rest are built? | Row pitch, production batch | 08, 12 |
| 20 | Can you charge the bike where you ride it? | Length of a ride day | 11 |
Summary
Measure first, lock the voltage before the cells, size the heat before you order, and don't build a hundred of anything until you've measured one.
Field survey data
The evidence behind the second half of chapter 01, kept here so that the chapter can carry the argument and this appendix the arithmetic. The percentages for Ukkonen and for the MotoE rows can be recomputed from these tables; those for the other programmes come from the project's benchmark CMP.
B.1 Reference times
The baselines the percentages in chapter 01 are calculated from:
| Circuit | Premier | Middle | Entry | Basis |
|---|---|---|---|---|
| Jerez | MotoGP 1:36.025 | Moto2 1:39.642 | Moto3 1:44.352 | MotoGP all-time record (practice); Moto2 and Moto3 race lap records LAPREC |
| Isle of Man TT | Superbike 135.970 mph | Supersport 130.403 mph | Supertwin 124.530 mph | official records |
| Barber | Superbike 1:24.51 | Supersport 1:27.28 | — | 8-lap race averages, 2026 |
| KymiRing | Superbike 1:51.09 | Supersport 1:55.60 | Retro SBK 2:03.73 | race pace, 15 Aug 2025 |
B.2 Does the choice of baseline change the answer?
A fair objection to all of the above: MotoGP is not an obvious yardstick for an electric bike of about 225 kg. Superbike is the closer class on mass and power, and the comparison is testable rather than arguable, because MotoE and WorldSBK share several circuits. Better still, MotoE runs on the same weekend as MotoGP, Moto2 and Moto3, which allows a properly controlled comparison: one track, one weekend, one set of conditions, four classes.
Start with the official race lap records at three circuits MotoE visits.
| Circuit | MotoGP | WorldSBK | MotoE | vs MotoGP | vs WSBK |
|---|---|---|---|---|---|
| Assen · 4.542 km | 1:31.866 | 1:32.357 | 1:39.592 | +8.4 % | +7.8 % |
| Mugello · 5.245 km | 1:45.470 | — | 1:55.617 | +9.6 % | — |
| Jerez · 4.423 km | 1:37.081 | 1:37.659 | 1:47.473 | +10.7 % | +10.1 % |
Two caveats belong with that table rather than under it. Mugello has no usable Superbike baseline at all: the WorldSBK record there was set in 1994 and the series no longer visits, so the cell is empty rather than unknown. And the Jerez MotoE record still belongs to the Energica, which means that row compares a 2021 machine against 2025–26 records for everyone else. It is the weakest line in the table, and it is the one the project's own benchmark was built on.
The same-weekend figures avoid all of that. These are the best race laps set by each class at one meeting.
| Class | Assen, 25 Jun | Mugello, 11 Jun |
|---|---|---|
| MotoGP | 1:33.065 | 1:46.807 |
| Moto2 | 1:36.697 | 1:51.345 |
| MotoE · Ducati V21L | 1:40.281 | 1:55.727 |
| Moto3 | 1:41.752 | 1:56.298 |
| MotoE gap to MotoGP | +7.8 % | +8.4 % |
| MotoE gap to Moto3 | −1.4 % | −0.5 % |
And a Superbike anchor for the same circuit and season: at Assen in April 2023 Bautista's fastest lap of the Superpole race was 1:33.780, which puts the V21L +6.9 %, the smallest MotoE gap anywhere in this book.
Two things fall out of all this, and the second is the one worth having.
The ordering never moves. Whichever baseline, whichever circuit, MotoE sits seven to eleven percent off the front. Choosing Superbike instead of MotoGP as the yardstick moves the number by roughly half a percentage point, because WorldSBK itself is within half a second of MotoGP at these circuits; a prototype's aero and power advantage counts for much less than intuition suggests. The conclusion does not move at all.
But the size of the gap depends on the circuit, and it depends on it in exactly the way the mass argument predicts. The deficit is smallest at Assen, which is fast and flowing; larger at Mugello, which has a 1.1 km straight but also heavy braking into slow corners; largest at Jerez, which is tight and stop-and-go. It tracks the number of hard accelerations per lap, not the length of the straights. That is the signature of a machine limited by acceleration (the drive force it can put down, divided by its mass) rather than by grip or by top-end power, and the explainer in chapter 01 has the algebra for why.
The Moto3 row deserves a second look, because it overturns something. A figure that is often repeated has MotoE about 2 % slower than Moto3, and the ladder table in chapter 01 shows 2.6 % for the Ducati at Jerez. On same-weekend data the Ducati is faster than Moto3 at both Assen and Mugello. Those figures compare laps of different kinds: a 2021 Energica lap, or, in the Jerez row, a Ducati test lap from March 2023, each against Moto3 records from other years and conditions. A test lap is like-for-like against qualifying records at best, and against race pace not at all. Neither survives a controlled comparison.
B.3 The choices that separate them
Within that shared constraint, the surviving programmes have made noticeably different bets. The clearest one is how they reach their torque × rpm product, the number chapter 05 is about.
| Bike | Torque | Strategy |
|---|---|---|
| Ducati V21L | 140 Nm @ 18 000 rpm | High speed, modest torque. Needs gearing and bearings that survive the rpm; the driveline sees relatively little force. |
| Lightfighter V3-RH | 162 Nm at the motor BEXIF | A high-speed motor with an integral 2:1 gearbox, so the reduction is built in and 324 Nm leaves the gearbox. |
| Energica Ego Corsa | 220 Nm | Middle ground; also the heaviest of the group at 260 kg. |
| Ukkonen Mk4 | 331 Nm @ 5 500 rpm | Low speed, high torque: a consequence of the EMRAX's large diameter and low rated speed, not of its axial-flux layout (chapter 05 compares four axial-flux motors from 5 500 to 14 000 rpm). Buys a simple single-ratio driveline and pays for it in chain, sprocket and swingarm-pivot loads. |
Ukkonen is the outlier here, and this was a consequence of the motor choice rather than a strategy chosen on its merits. It isn't obviously wrong, but it does mean the driveline strength requirement is an open item on this project and not on the others; it is recorded as O20.
The second bet is the pack, and here the convergence is more striking than the divergence:
| Ukkonen Mk4 (design) | Ducati V21L | |
|---|---|---|
| Cells | 1 080 × 21700 | 1 152 × 21700 |
| Energy | 19.4 kWh | 18 kWh |
| Parallel strings | 6P | 6P |
| Voltage | 648 V nom / 756 V | 800 V class |
| Pack mass | ~102 kg | 110 kg |
| Coolant circuits | two, separate | two, separate |
| Mass, no rider | 253.0 kg analysed · 219.6 kg target | 224.5 kg |
None of that was copied. It came out of cell testing, lap data and a thermal model, and it landed within about eight percent of a works MotoGP-adjacent prototype on every line but mass, where the analysed figure is 13 % heavier and the target 2 % lighter. That is worth knowing when you are deciding whether your own numbers are plausible: if an independent route lands you somewhere very close to where the best-funded team in the category ended up, that is evidence the constraints are real and not a coincidence of your assumptions. DUCATIHB 30
One caveat on that table, in the spirit of chapter 12: the project's own benchmark document quotes 233 kg for Mk4 where the mass budget says 219.6 kg. Both are stated as being without the rider, so one of them is wrong or they are counting different things — recorded in the errata rather than quietly resolved. MBCMP
The third bet is generational: when MotoE replaced Energica with Ducati, torque fell 36 %, mass fell 35 kg, power stayed the same — and the bike got faster. Chapter 02 uses that case for a different job, checking that a simulation's mass sensitivity is the right size.
B.4 And if you're starting from nothing
The bikes above are not the right reference for a first project. The realistic entry point is MotoStudent Electric, which runs around eighty universities from nineteen countries, and where a typical bike is about 10 kWh at 100 V rather than 19 kWh at 650 V. That is a different design problem (low voltage changes the inverter, the safety case and the whole of chapter 06), but the order of work in chapter 04 is the same, and so is the finding that mass and grip come before power. CMP
B.5 Lightning and Lightfighter, in full
Lightning builds road motorcycles rather than running a racing programme, but its race-prepared machines are the sharpest version of the straight-line point, and the one that most deserves to be stated carefully. The LS-218 is named for the 218 mph (351 km/h) it ran at Bonneville, it has been listed as the fastest production motorcycle of any kind, and in 2013 a race-prepared one won the Pikes Peak International Hill Climb in open competition, ahead of the combustion motorcycles LSWIKI. It is worth mentioning, but no comparable circuit lap times from recent years are available, so Lightning is not part of the lap-time comparison.
Lightfighter's V3-RS is published at 181 kg ready to race, about the weight of a Ducati Panigale V2 by its makers' own comparison, with 115 kW LFV3NEWATLAS. The lap time in the comparison is from the V3-RH, the Super Hooligan version of the same bike: 1.5 % off Supersport at Barber, against 3.7–7.9 % for the heavier machines against their middle class. Barber's baseline is race pace, the softest of the three, so that flatters it somewhat; the direction is still clear. What is left against Superbike is power, since the Super Hooligan version races at 100 kW. The pack is not small: 12.5 kWh in one published account and 16 kWh on the team's own specification page, against 18 kWh in the MotoE bike DUCATI. It uses pouch cells, which the supplier says take about a fifth less space than cylindrical ones FARASIS; one published account puts it at roughly seven minutes of full throttle, and the Super Hooligan races in the comparison are eight laps long CMP. The pack is air-cooled with external fans between races, and the team lists pre-cooling among the conditions a lap time depends on FARASISLFFAST. None of the published material says whether heat or energy runs out first.
Errata and open conflicts
Corrections to figures the project published before this revision, and the conflicts in the project material that are still unresolved. Written in the spirit of chapter 12: recorded, not patched.
Corrections
Each line says what was stated, what the book states now, and what the correction rests on. Corrections to this revision will be added here in the same form. The numbers are identifiers, so that an entry can be referred to from elsewhere without ambiguity.
| # | Where | Was | Now | Basis |
|---|---|---|---|---|
| E1 | Published Mk1 performance figures | 262 hp and 856 Nm at the rear wheel, and "over 240 km/h", repeated in project presentations since 2022 | The speed is right: the airfield logs give 240.4 km/h. The power is not: peak electrical input to the motor was about 100 kW at the airfield (up to 302 A from the pack) and 87 kW at Imatra, roughly 135 hp at most, and output at the wheel is less | Roller-dyno figures with a probable speed or rpm channel error; power is torque times speed, and the torque figure is plausible on its own. Power here is pack voltage × pack current: the logger's exported q-axis current reads tens of amps where the pack delivers 300, so no power figure is taken from the d/q channels. HISTDECK |
| E2 | Ch 00, 01 and 06 — top speeds on a circuit | Mk2 221.1 km/h; Mk3 234 km/h, "measured", as reported by the project earlier | Mk2 203.3 km/h and Mk3 232.3 km/h. Both tables now say which session each figure comes from: chapter 00 the fastest circuit session of each bike, chapter 01 the same circuit for Mk1 and Mk2 and the first KymiRing session for Mk3 | Re-read from the logs. Mk2's 221.1 was a single GPS sample at 2.45 s into a session, with three satellites and the wheel turning at 9 km/h; its real best is 203.3 km/h, confirmed by wheel speed. Mk3's 234 km/h was the simulation's value; the logged figure is 232.3, and 4 530 rpm on the gearing of the day is 233 km/h. Raised by the project lead. HISTAiMWB s6 |
Checked and confirmed
Not everything that was checked needed changing. These held up against the source data and are worth listing so the reader knows they were checked rather than inherited.
- Per-cell current on Mk3. The logged lap gives 24 A RMS and 39 A peak per cell on 624 cells, consistent with the 40 A peak used throughout and with the 21 A RMS predicted for Mk4's larger pack. AiM
- Bench versus track. The 24-cell test modules at 21 A per cell reached the 52 °C cut-off in five to six minutes uncooled and in about eight at best with the bench cooling; the track session at 24 A RMS lasted nine. Same failure, same scale. LOAD
- The thermal chain arithmetic. 0.72 + 0.41 + 0.28 + 1.20 K/W ≈ 2.6 K/W, times 5.62 W ≈ 14.7 K, against the 14.8 K stated. The cell-core link at 0.72 K/W is 28 % of the chain, which the figure had inferred and the check confirms from the same document. CC §02/§09
- The 85 °C arithmetic. Arrhenius with 50 kJ/mol from 45 to 85 °C gives a factor of 8.3; the busbar resistances, powers and sags reproduce from resistivity and geometry; the adiabatic 30-second temperature rise on 1 mm copper comes out at 14–16 K.
- Ducati V21L and Molicel P50B headline figures against the manufacturers' own publications. DUCATIMOLI
- The nickel-versus-copper division of labour. Independent of the project's own calculation, the published literature gives the same answer from the other direction: nickel is the compatible metal against steel, copper-to-steel avoids the Al–Fe intermetallics but has cracking problems of its own, and aluminium-to-steel needs its brittle intermetallic layer kept thin, with about ten micrometres the usual rule of thumb. The project arrived at the industry's answer by arithmetic; the metallurgy agrees. ASIRVNIPLATECUFE
- WorldSBK is close to MotoGP. Checked at Assen as well as Jerez: 1:32.357 against 1:31.866, about half a percent. The observation holds at a second circuit. LAPREC
- Radial conductivity assumption. The 0.83 W/mK the cooling design uses sits inside the published range for cylindrical cells and above the careful 18650 measurements, so it is an upper-end assumption as the design document says. KOLLER
Open in the project material
These are conflicts or gaps in the source documents that this book found and does not resolve. Each belongs in the project's own conflict list.
| # | What | Where it lives | Why it matters |
|---|---|---|---|
| O1 | Workbook summary sheet lists −1.78 s as the mass item | Workbook sheet 1, row 2 of the priority list; copied into the project handbook's vehicle-level page | It is the cumulative braking + mass step. Both should be corrected at source, or the next reader repeats E1. |
| O2 | Per-cell current stated on two voltage bases | Workbook sheets 0 and 3; cooling document | 40 A (loaded, ~557 V) and 34.7 A (nominal, 648 V) both appear as “race load”; the 15.2 W peak dissipation in the cooling document is on the nominal basis. Pick one basis and say which. |
| O3 | Sleeve insulation figure doesn't follow from its inputs | Cooling document §09 | ρ ≥ 10¹⁴ Ω·m through 0.07 mm over 9.6 cm² gives several TΩ, not the 61 GΩ stated. Either the resistivity, the thickness or the area used is different from the one written down. Harmless in effect (both numbers are enormous), but worth knowing which is meant. |
| O4 | Mk4 mass without rider: 219.6 vs 233 kg | Mass budget vs competitor benchmark | Both say “without rider”. One is wrong or they count different things. |
| O5 | Insulation requirement: 100 vs 500 Ω/V | FIM material vs cooling document | Five-fold; sizes the whole insulation structure. |
| O6 | Module division: 5 × 36S6P vs 12 × 15S6P | Workbook vs cooling document | Same cell count, entirely different physical architecture; blocks CAD. |
| O7 | Cooling-channel dimension correction only partly applied | Cooling document, T15 | Corrected outside dimension is in one drawing; parts list and other drawings show the old figures. Don't cut tooling before it is carried through. |
| O8 | Cell diameter: 21.55 (manufacturer) vs 21.22 mm (measured) | Cooling document vs Titievskaja 2024 | The whole channel geometry is derived from it. Measure ten cells rather than pick a source. |
| O9 | Thermal pad datasheet is for the wrong variant | Folder 05 has the 4012 sheet; the selected part is 1412 | Volume resistivity and service temperature should be confirmed for the part actually ordered. |
| O10 | Coolant layer thickness: 3 mm against 1.5 mm | Cold-plate thesis versus Mk4's radial dimension chain | Different geometries, so not strictly a conflict, but a factor of two. The channel figure should be defended on its own optimisation rather than inherited. HUSUCOLDPLATE |
| O11 | Cold-plate pressing is proven on the wrong alloy | Cooling thesis, §4.2.1 | Specified 6063-T6, pressed in 1000-series because 6000 was unavailable. The dies worked first time on the softer alloy; the process is unproven on the specified one. Relevant to Mk4's channel tooling. |
| O12 | Wheel and tyre inertia has never been measured | Ch 09's gyroscopic estimate | ≈ 1.3 kg·m² is built up from component masses and radii of gyration. Everything in that section scales on it, and a pendulum test on the actual wheels is an afternoon. Scheduled. |
| O13 | Mk1's inertial unit was never calibrated | 2022 logs | Its lateral channel reads about half the GPS figure on the same laps. Every Mk1 conclusion in this book therefore uses the GPS channel. Worth a note in the data procedure so the same class of fault is caught on the next bike. |
| O14 | Mk2 has no lap times and never will | Motopark, 8 Oct 2023 | The beacon was not configured, so the only generation without a recorded lap time is the one between the first race and the current bike. Telemetry exists; timing does not. |
| O15 | The competitor's 2022 top speed is recorded twice, differently | Imatra, 2 Jul 2022 | 274 km/h in the diary of the day, 270 km/h in the project lead's written report of the same weekend. Neither is this project's measurement, and nothing in the book depends on which is right; the text says "about 270 km/h" for that reason. DIARY |
| O16 | A logger flag named "Torquehalving" reads 1 for the whole 2022 race and 0 after the restart | Imatra race log, 2 Jul 2022 | Its meaning is not documented anywhere in the project material. If it means what its name says, the race was run with torque halved from the grid, which would be a different explanation for the same result. Worth ten minutes with whoever configured the Sevcon's CAN map. HIST |
| O17 | Centre-of-gravity height is carried as two different estimates | Workbook sheets 0 and 4 | 0.65 m in the locked-choices sheet, 0.60 m in the sensitivity sheet. The stoppie limit is 1.08 g at the first and 1.17 g at the second, and chapter 09's 0.4 s for a 50 mm lower CG is computed from the second. An hour with axle scales settles it. WB s0/s4 The 0.60 m, and the 0.4 s computed from it, are on the older sensitivity sheet, which was computed for the 104S pack and is marked superseded; E2's split of the braking bar rests on the same sheet. |
| O18 | The CG warning in chapter 09 rests on provisional references | Ch 09, reference CG | The point is standard motorcycle dynamics, but the book cites a magazine article and an encyclopaedia for it until the project's copy of MotoGP Technology is available again. Replace CG with the page reference in SPALD. CG |
| O19 | A dyno run at about 5 500 rpm is remembered but not on file | Dyno sessions; project data folders | The logged maximum is 4 530 rpm on Mk3. The team recalls running the motor at about 5 500 rpm on the dyno, which would support the lap simulation's speed assumption (chapter 05). Until the data is found, the book treats 5 500 rpm as unmeasured. LOG |
| O20 | Driveline strength for Mk4 | Workbook locked choices, item F2; appendix B, ch 04 and 05 | Mk4 puts 331 Nm × 2.50 ≈ 826–843 Nm to the rear wheel, 1.43 times Mk3's 579 Nm, and the present driveline was sized for about 550 Nm. The requirement is at least the configuration's own 843 Nm, with an allowance to about 1 030 Nm, which is what the 500 Arms development step would need (workbook item E, "1 030 Nm"). Gears, chain and sprockets (the chain maker's limit is about 6 000 N on a 16-tooth sprocket, against 6 771 N at 16/48), and the swingarm pivot need calculating before CAD fixes them. Owner and load cases to be assigned. WB s0 F2 |
| O21 | Coolant temperature, design ambient and radiator | Ch 04 requirements; ch 08; cooling document §08 | The requirement assumes coolant ≤ 30 °C at the pack inlet. The cooling document sizes the radiator at 607 W/K for 25 °C air and 35 °C coolant, a few degrees above the project's 22 °C estimate for a Finnish summer race day. Neither the radiator nor the design point is tested; a hot day raises the requirement by 20–50 %. CC §08FMI |
| O22 | Mk2's peak lateral acceleration in ch 01 could not be reproduced exactly | Ch 01 figure; generation archive | The figure shows 1.14 g. Re-reading the Motopark 2023 files gives 1.08–1.11 g pooled across the sessions and up to 1.23 g in the best single session, depending on how the sessions are selected. The ordering of the three generations is unaffected; the selection rule behind 1.14 should be written down. HIST |
| O23 | Braking limit written as 1.05 g in one place | Workbook sheet 0, staircase note | The note gives the braking step as 1.05 → 1.25 g; the simulation's parameter is 1.10 g, against 1.04 g measured. Correct the note at source. WB s0/s6 |
| O24 | Rider mass: 70 kg in the calibration, 75 kg in the Mk4 predictions | Workbook sheet 6 (195 + 70 = 265 kg) and sheet 0 (253.0 + 75 = 328.0 kg) | Worth about 0.12 s between the calibration and the predictions. Where the two figures came from is not recorded. WB s0/s6 |
References
Every reference key in the text points to an entry in this list. Paths are relative to the project folder 03 Ukkonen.
The list is grouped by what kind of evidence each item is, because that matters more than alphabetical order: a measurement of our own bike, a configuration file as it actually ran, a manufacturer's statement and a thesis carry different weight, and a reader should be able to see which is which.
Our own measurements and calculations
Ukkonen lap simulation, re-run and documented, 30 September 2026
10 Käsikirja/Ukkonen - kierrosaikasimulaatio.html (internal)
The workbook's lap model re-run from the same measured data, formulas and parameters, with every step shown; each staircase step lands within 0.15 s of the workbook. Used in chapters 01 and 03 for the value of 25 kW more power on the locked configuration (EMRAX with 180S6P): 0.44 s on a single lap, with about 30 % of the lap limited by the power cap. The workbook's earlier 0.03 s came from sheet 4, computed for an older motor configuration (AXM2), for which the same model gives exactly that.
Powertrain analysis workbook
01 Analyysi/Ukkonen - voimalinja-analyysi.xlsx
16 sheets; the project's primary calculation document. Sheet 0 holds the locked choices and the mistake list, sheet 1 the current status, sheet 3 the cell comparison, sheet 6 the simulation method, sheet 9 torque and power, sheet 10 measured data, sheets 13 and 15 the source lists. Sheets 2, 4, 5, 7, 8 and 14 are superseded; they were computed for the earlier 104S pack. Cited as WB s<sheet>.
KymiRing lap data and session summary, 9 Aug 2024
02 Mittausdata/2024-08-09 KymiRing - AiM MXL2 kierrosdata.csv (13.5 MB)
02 Mittausdata/2024-08-09 KymiRing - AiM sessioyhteenveto.xlsx
The calibration point for the entire simulation: a clean lap of 2:00.50 ridden by Eemeli Lahti: the logged best of 2:02.588 less about 2 s of traffic, the rider's estimate verified from the sector times. Also the source for the power profile, the thermal behaviour, the cornering accelerations, and the session trace showing the current limit falling from 452 to 142 A with 58 % SOC remaining.
Cooling channel design, rev D, 15 Sep 2026
01 Analyysi/Ukkonen - jäähdytyskanava.html (also as PDF, 22 pp.)
The most recent and most detailed part of the material, and ahead of the workbook's cooling line. Source for the thermal chain, the h requirement derivation, the channel structure, the interface material, the restrictor and the fallback plan. Cited by its own section numbers, CC §nn. Note that its dimensional correction is still incomplete; see the project handbook's conflict list.
Mass budget, 11 Sep 2026
01 Analyysi/Ukkonen - massabudjetti.xlsx
01 Analyysi/Ukkonen - komponenttipainot MK1 ja MK2 (18.8.2025).xlsx
49 component lines; column C is updated as parts are weighed, and some lines are still estimates. The baseline of 253.0 kg and the target of 219.6 kg both come from here.
Battery load test records
03 Akkutestit/Akkujen kuormitustestit - mittauspöytäkirjat.xlsx
Measured internal resistances and heat transfer coefficients for the P42A and P50B cells. The project's most important original measurement series, and the reason the cell figures in this handbook are measured rather than quoted.
Competitor benchmark, 10 Sep 2026
01 Analyysi/Ukkonen - kilpailuvertailu tiimille (10.9.2026).md
01 Analyysi/Ukkonen - kilpailuvertailu 10.9.2026.pdf
Comparison against every purpose-built electric race motorcycle with published lap times: Ducati V21L, Energica Ego Corsa, Mugen Shinden Hachi and Lightfighter, each normalised against the reference classes at its own circuit. Source for the whole field survey in chapter 01, for the MotoE Energica→Ducati validation case, and for the torque-versus-rpm observation.
Underlying public sources, as recorded in that document: MotoGP and Crash (MotoE results and Jerez records); MotoAmerica and MCNews (Barber 2026); Isle of Man TT official records; Ducati and Electrek (V21L specifications); Lightfighter Racing's own race journal; MotoStudent (the university field). KymiRing class paces are from the 15 Aug 2025 meeting. These are secondary sources compiled by the project, not primary timing data. Treat the percentages as good to about a tenth of a percent, not better. Its Ducati energy figure (18 kWh) is the one this book prefers over the derived values elsewhere in the project; for mass the book uses Ducati's own published 224.5 kg (DUCATI).
Published lap records, verified 18 Sep 2026
External sources, checked directly rather than taken from the project's benchmark
Used for the baseline check in chapter 01. MotoE Ducati V21L at Jerez, 1:47.053 (Granado, test, March 2023) and the Energica record it beat, 1:47.473 (Granado, 2021), from Crash.net MotoE test results. WorldSBK Jerez Superpole record 1:36.629 (Bulega, October 2025), from Motorsport Week and worldsbk.com. MotoGP Jerez all-time record 1:36.025 (Bagnaia, practice, April 2024), superseding his own 1:36.170 from 2022, from Roadracing World. These figures were checked against primary reporting rather than inherited from CMP, which is why they carry their own key.
Extended 19 Sep 2026 to three circuits. Official race lap records for the current configurations: Assen 4.542 km: MotoGP 1:31.866 (Bagnaia 2024), WorldSBK 1:32.357 (Bulega 2026), MotoE 1:39.592 (Zaccone 2025), Moto2 1:35.580, Moto3 1:40.395; Mugello 5.245 km: MotoGP 1:45.470 (Bagnaia 2026), MotoE 1:55.617 (Zaccone 2024), Moto2 1:49.497, Moto3 1:54.738, with no usable WorldSBK baseline because that record dates from 1994; Jerez 4.423 km: MotoGP 1:37.081, WorldSBK 1:37.659, MotoE 1:47.473 (still the Energica), Moto2 1:39.642, Moto3 1:44.352. Same-meeting best race laps, 2023: Assen 25 June: MotoGP 1:33.065, Moto2 1:36.697, MotoE 1:40.281, Moto3 1:41.752, MotoGP pole 1:31.472 and MotoE pole 1:40.743; Mugello 11 June: MotoGP 1:46.807, Moto2 1:51.345, MotoE 1:55.727, Moto3 1:56.298. The MotoE session data was read from the championship's own results API rather than from a summary. The Superbike anchor at Assen is the 2023 Tissot Superpole race classification: Bautista, fastest lap 1:33.780 on lap 6, 23 April 2023, from the promoter's own timing PDF.
Ducati V21L MotoE prototype — published specification
Ducati / Motorcycle.com first-look feature, checked 18 Sep 2026
224.5 kg without rider, 110 kW, 140 Nm, 18 000 rpm, 18 kWh, 800 V class, 1 152 cylindrical 21700 cells, 110 kg pack, two separate liquid circuits, 20 kW charging socket for an external charger (about 45 min to 80 %), 275 km/h at Mugello. Used for the architecture comparison in chapter 01 and the charging scale in chapter 11. Where the project's own documents derived different figures (18.66 kWh, 806 V) from the cell count, this edition uses Ducati's stated ones.
Decision log
10 Käsikirja/02 Päätösloki.md
One line per decision, with date, reasoning and what it supersedes. Lines are never edited after the fact: a change of direction is a new line referring back. Also carries the abandoned paths and what was salvaged from each. Cited with the date of the relevant entry.
Project handbook, subsystem pages
10 Käsikirja/ — 00 read-me and conflict list, 01 locked choices, 03 open questions, 10 vehicle level, 20 powertrain, 30 energy storage, 40 thermal, 50 electrical, 60 chassis, 70 charging, 80 data, 85 procurement, 90 safety, 95 communications, 99 student projects
The readable form of the workbook, split by subsystem, each page carrying its own requirements table, interfaces and sources. Cited as HB <page number>. Where the two disagree, the workbook is authoritative and the handbook page has fallen behind, with one exception: the conflict list in 00, which exists precisely to record where the workbook contradicts itself.
Generation archive — AiM logs 2022–2024, Mk1 to Mk3
08 Tausta-aineisto/07 Media ja historia/Esitykset/datat/ — 46 exported sessions and the AiM originals
Mk1 at Motopark (22 Jun 2022), Imatra (1–2 Jul 2022) and five straight-line runs at a closed airfield (6 Sep 2022) with Sevcon channels including Id, Iq, Ud, Uq, pack voltage, motor speed and temperatures; Mk2 at Motopark (8 Oct 2023) and Mk3 at KymiRing (13 Jul 2024) with Cascadia channels. All figures quoted from it in this book were recomputed from the raw files with one processing chain: GPS outliers removed, peaks reported at the 99.9th percentile rather than as maxima. Known defects, stated because they bound what the archive can answer: the Mk1 inertial unit is uncalibrated and reads about half the GPS figure; the Mk2 session has no lap timing; and the exported q-axis current channel is inconsistent with the d-axis and pack-current channels (it reads tens of amps where the pack is delivering 300), so no power figure is taken from the d/q channels at all. Electrical power in this book is pack voltage × pack current throughout. Top speeds are session maxima of the GPS channel after start-up samples are removed and cross-checked against wheel speed; the Mk2 session contains a start-up artefact of 221 km/h that was earlier reported as the bike's top speed (errata E2).
Configuration as it actually ran
Inverter settings from the fastest lap
05 Komponenttidokumentit/2024-08-09 Cascadia CM200DX - kaytossa olleet asetukset (EEPROMinuse).txt
02 Mittausdata/2023-06-29 Cascadia CM200DX - asetukset (EEPROM).txt (earlier, for comparison)
The actual parameter set in the inverter during the calibration lap. This is where the settings mistakes in chapter 10 were found — a dump of what the machine was really doing, not what anyone believed it was doing.
BMS settings in use, 2026
05 Komponenttidokumentit/2026 Orion BMS2 - kaytossa olevat asetukset.o2bms
Pack capacity, current limits, the temperature derate curve and the cell count as configured. Source for the derate behaviour that ended the 2024 session.
Manufacturer documentation and correspondence
Emrax motor manual v1.7
05 Komponenttidokumentit/Emrax - moottorin kasikirja (v1.7, uusin).pdf
Datasheet values for the 268 MV: torque constant, magnet flux, Kv, speed limit, mass and diameter. The contrast between these and the measured values is the point of the example in chapter 5.
Inverter hardware, software and CAN manuals
05 Komponenttidokumentit/Cascadia CM200DX - laitteisto-ohje (0A-0162-05).pdf
05 Komponenttidokumentit/Cascadia CM200DX - ohjelmisto-ohje (0A-0163-04).pdf
05 Komponenttidokumentit/Cascadia CM200DX - CAN-protokolla (v6.2).pdf
05 Komponenttidokumentit/Cascadia - Emrax-moottorin käyttöönotto (rev 1.2).pdf
The software manual covers the whole CM family, including the CM200DZ planned for Mk4; the hardware manual on file is the CM200DX used on Mk2 and Mk3. Voltage window, current ratings, the parameter definitions behind chapter 10, and the commissioning procedure, in particular §4.1.2 Verifying Resolver and Motor Direction and §4.1.3 Resolver Angle Offset Adjustment, which give the ±0.7° alignment target and the coast-down method. Chapter 10's case on resolver direction reads §4.1.2 together with the field-weakening section (§6.2).
Mini Module & BMS info book, with P42A measurements
05 Komponenttidokumentit/Cascadia Mini Module ja BMS - tietokirja (P42A-mittausdata).xlsx
Measured Thévenin parameters and open-circuit voltage for the P42A cell as a function of temperature, plus the specification of a production liquid-cooled module. Also the source of the DCL table showing full current permitted to 60 °C.
BMS manual
05 Komponenttidokumentit/Orion BMS2 - kayttoohje.pdf
The 180-cell maximum and the 12-cell connector grouping: the ceiling that actually decided the series count.
Independent technical review of Mk1's settings and logs, October 2022
Project correspondence, introduced through the centre's Professor of Practice, Jamie Hyneman
An unpaid review of the project's inverter configuration and data by an experienced motor engineer in the electric-motorcycle industry, arranged through the centre's Professor of Practice. The reviewer is not named here, and the correspondence is paraphrased, not quoted; it was a favour to a student project, not a publication. Source of four things this handbook uses: the sign-convention diagnosis (chapter 10), position-sensor latency named as a calibration item alongside amplitude and offset (chapter 10), the modulation-index test for finding a hidden limit (chapter 06), and a settings cause behind a rider complaint: a torque rate limit set far too low (chapter 12). Also the case for sizing a powertrain with headroom and capping it (chapter 07), and the estimate of what tuning an inverter costs in dyno hours. The reason it appears in chapter 12 as well is that most of it was not acted on at the time, which is the more useful half of the story.
Cascadia Motion support — correspondence, 2023
Project correspondence with the manufacturer's technical support
Two episodes from Mk2's commissioning, used in chapter 10: a parameter-setting mistake and the recovery of the unit's calibration, and a speed-dependent resolver angle error and the setting that corrected it. Private support correspondence, paraphrased rather than quoted. The manufacturer's technical support helped the project through both, and the account in chapter 10 is the project's own.
Magelec Propulsion — motor catalogue, 2022
08 Tausta-aineisto/05 Komponenttivaihtoehdot/
Datasheet figures for the M21 series in both the 200–600 V and 600–800 V ranges, used for the motor comparison in chapter 05 and retained as the fallback if 1 080 cells will not package alongside the EMRAX. Note the limit stated there: the torque constants used in the comparison are derived from catalogue peak torque and peak current, not measured, and price and lead time are unknown.
Cell datasheets
04 Kennodatalehdet/ — Molicel INR-21700-P42A (Mk3) and INR-21700-P50B (Mk4); also INR-18650-P30B and INR-21700-P60C (tentative) for comparison
Discharge temperature range, absolute surface maximum and current ratings. The datasheets for the two cells actually in use, P42A (Mk3) and P50B (Mk4), are filed in 04 Kennodatalehdet; chapter 10 uses them for the charge limits.
Thermal interface material datasheets
05 Komponenttidokumentit/ICT Suedwerk ICT-TC-GFSP-4012 - lamporajapintatyyny, datalehti.pdf
05 Komponenttidokumentit/ICT Suedwerk ICT-BFG and ICT-BFG-A brochures
Thermal conductivity, dielectric strength and thickness for the interface pad. Note: the product selected is the 1412 variant, while the folder holds the 4012 datasheet, recorded as a known discrepancy.
Chassis dyno and acquisition software manuals
05 Komponenttidokumentit/Manual D50 EN.pdf
05 Komponenttidokumentit/Manual ADS software 2022 ENG.pdf
Eddy-current brake with a load cell. The measurement plan in chapter 12 (log everything on one timebase, prioritise what can't be reconstructed) was written for this machine.
Theses and literature
All under 08 Tausta-aineisto/, indexed in that folder's own contents file with an assessment of what each is actually good for in this project.
Flanagan 2022 — PhD thesis, University of Nottingham
08 Tausta-aineisto/01 Ajoneuvomalli ja simulaatio/ (250 pp.)
A fully validated electric race motorcycle vehicle model: Pacejka tyre model, battery electrical and thermal model with the entropic term, motor and inverter loss models, point-mass lap simulation, validated against Isle of Man TT Zero, Pikes Peak and Elvington. The only document that yields simulation parameters directly: coast-down measured CdA 0.335, mass sensitivity 0.021 s/kg, CdA sensitivity 0.22 s per point.
Titievskaja 2024 — BSc thesis, LUT
08 Tausta-aineisto/03 Akku - lampo ja turvallisuus/
Mk3's air-cooled pack analysed as a pressure-drop network, solving the flow distribution between modules. The project's own documented case of what happens when parallel-path distribution isn't controlled, and the source of the 38/62 % split quoted in chapter 8. Also contains measured surface roughness and a measured cell diameter of 21.22 mm, which is a third value alongside the two manufacturer figures.
Sarras 2026 — BSc thesis, LUT
03 Akkutestit/Sarras Otto - Kandidaatintyö - akkujen nestejäähdytys.pdf
Testing of liquid cooling systems for battery packs, with 6S4P test packs of P42A and P50B cells. The dummy-load rig and the earlier bench test behind the measurement method in chapter 12.
Li 2025 — BSc thesis, LUT
08 Tausta-aineisto/03 Akku - lampo ja turvallisuus/
Phase-change material and heat pipe thermal management, CFD in Ansys Fluent at a 3C discharge. Concluded that increasing thickness improves performance but does not reach the target. A negative result, and the reason the liquid-circuit decision is defensible rather than merely conventional.
Salmi 2022 — BSc thesis, LUT
08 Tausta-aineisto/01 Ajoneuvomalli ja simulaatio/ (41 pp.)
Stability control for this bike specifically: traction control, wheelie detection, Pacejka's Magic Formula, determination of optimal slip ratio, and the ESC signal flow. The basis for estimating how much of the grip gap traction control could realistically close.
Das 2018 — peer-reviewed, University of Warwick
08 Tausta-aineisto/02 Akku - rakenne ja valmistus/ (13 pp.)
Review of battery pack joining techniques (ultrasonic, laser, micro-TIG, resistance welding, mechanical), with a manufacturing-readiness rating and separate Pugh matrices for cylindrical, pouch and prismatic cells. The best single source for the joining decision in chapter 7.
Neil Spalding — MotoGP Technology, 3rd edition
Book; the project's reference for chassis and powertrain practice at the top of the sport
The reasoning behind reverse-rotating crankshafts and the trade between gyroscopic moment and direction-change agility, and the background to big-bang firing orders. Used in chapters 09 and 10 as the source of the argument, not of any number: nothing in this handbook's gyroscopic estimate is taken from it.
Husu 2025 — bachelor's thesis, LUT, commissioned by the J. Hyneman Center
08 Tausta-aineisto/Kandidaatintyo_Husu_Antti.pdf (48 pp. + 12 appendices)
Design and prefabrication of a liquid cooling solution for a 36-cell 6S6P 18650 test module, using VDI 2221. Contains a full worked requirement list, the cold-plate sizing chain, the pressing dies, and the manufacturing record. Its most valuable content is negative: aluminium busbars were never successfully laser-welded to a single cell, which is why the cooling performance was never measured. Used in chapters 04, 07, 08 and 12. Note the limit: this thesis is evidence that the structure can be built, not that it cools adequately; no thermal measurement exists.
Asirvatham, Collins & Masters 2022 — peer-reviewed, University of Warwick
Optics and Laser Technology vol. 151; open access via the Warwick repository, checked 19 Sep 2026
Laser wobble welding of steel to aluminium busbar joints for li-ion packs. The paper states that aluminium to steel forms brittle Al–Fe intermetallics, that Fe2Al5 is the most stable and forms first, and that "many researchers suggest" limiting the layer to 10 µm; its own optimised welds held 5–20 µm. It also states that copper and iron form no harmful intermetallics. The book uses the formation order only as one of two reported orders (see BEYGI) and the 10 µm as a rule of thumb. The source for why aluminium is not a cell-interconnect material in chapter 07. Same research group as DAS.
Asirvatham, Masters, West & Harris 2025 — Influence of nickel-plating on laser weldability of aluminium busbars for lithium-ion battery interconnects, peer-reviewed
Journal of Materials Research and Technology vol. 36, 2025 (sciencedirect.com/science/article/pii/S2238785425009329), checked 25 Sep 2026
Laser welds of nickel-plated 1 mm AA1050A sheet lapped over unplated AA1050A, that is an aluminium-to-aluminium joint, with 3, 9 and 15 µm plating: lap-shear strength 840 N unplated, 1 075–1 225 N at the thinnest plating, about 1 520 N at 9 µm and about 1 590 N at 15 µm; porosity generally rises with thickness, least with sulfamate plating. Sulfamate nickel under 4 µm is recommended as the balance between strength, weld porosity and conductivity. No joint to a steel cell can is tested. Cited in chapter 07 for the point that aluminium busbars in use carry nickel plating, not as evidence about the aluminium-to-steel joint.
Beygi, Galvão, Akhavan-Safar, Pouraliakbar, Fallah & da Silva 2023 — Effect of alloying elements on intermetallic formation during friction stir welding of dissimilar metals: a critical review on aluminum/steel, peer-reviewed
Metals vol. 13 no. 4, 768 (open access), checked 25 Sep 2026
Review of Al–Fe intermetallic formation. States that Fe4Al13 can appear first, with iron diffusion then driving the layer towards Fe2Al5, and that the aluminium-rich phases (Fe2Al5, FeAl3) are harder than the iron-rich ones. Used in chapter 07 for the point that the formation order depends on conditions.
Zhang et al. 2017 — Analysis and modeling of the growth of intermetallic compounds in aluminum–steel joints, peer-reviewed
RSC Advances vol. 7, 37797 (open access), checked 25 Sep 2026
Brazed aluminium–steel interfaces: Fe2Al5 forms first, FeAl3 then grows into the aluminium, and 10 µm is given as the critical layer thickness for a joint with good mechanical strength. Used in chapter 07 alongside BEYGI, which reports the other order.
Gao et al. 2022 — Formation mechanism and control of solidification cracking in laser-welded joints of steel/copper dissimilar metals, peer-reviewed
Metals vol. 12 no. 7, 1147 (open access), checked 25 Sep 2026
Laser-welded steel–copper joints: the weld metal separates into copper-rich and iron-rich phases, and grain-boundary liquation drives solidification cracking. Used in chapter 07 for the point that copper to steel, although free of harmful intermetallics, is not free of metallurgical difficulty.
Total Materia — Welding of dissimilar metals, reference article
totalmateria.com/en-us/articles/welding-of-dissimilar-metals, checked 25 Sep 2026
Industry materials-database article: joints succeed where the metals are mutually soluble; aluminium–iron forms brittle intermetallics; nickel is the usual intermediate metal between copper and steel because it is soluble in both. A reference article, not peer-reviewed; used in chapter 07 for nickel's compatibility with steel.
Ziegler & Trancik 2021 — Re-examining rates of lithium-ion battery technology improvement and cost decline, peer-reviewed
Energy & Environmental Science vol. 14, 1635–1651 (open access; arXiv 2007.13920), checked 28 Sep 2026
From 1991 to 2018 the best commercially available lithium-ion cells rose from about 200 to over 700 Wh/l and from about 80 to over 250 Wh/kg, tracked year by year. Used in chapter 01 for the point that every lap time is tied to the cells of its year.
Cossalter 2006 — Motorcycle Dynamics, 2nd edition
Lulu.com, 360 pp., ISBN 978-1-4303-0861-4
Standard reference on motorcycle dynamics: tyres, geometry, suspension, handling. Cited in chapter 09 as where to read about suspension and geometry, which this book does not cover.
Cold-plate optimisation studies
Xi et al. 2025, International Journal of Thermal Sciences vol. 208; Zhan et al. 2024, Applied Thermal Engineering vol. 252; Tete, Gupta & Joshi 2022, Journal of Energy Storage vol. 48
Two independent optimisation studies put the useful coolant layer thickness in a cold plate at 2–3 mm; the third models liquid cooling of a pack of cylindrical cells in a square duct. Used in chapter 08 for the coolant-layer figure. Reached through HUSU rather than read in the original, and marked accordingly until checked at source.
Koller et al. — radial thermal conductivity of cylindrical cells, an uncertainty study of the pipe method
Peer-reviewed; summarised in an open review, checked 18 Sep 2026
Published radial conductivity values for cylindrical lithium-ion cells span 0.15–2.6 W/mK depending on method; careful measurements on 18650 cells cluster at 0.51–0.73, and method assumptions alone can move a result by 25 %. Cited in chapter 08 to place the cooling design's 0.83 W/mK assumption inside the known range, and as one of the three reasons the first module must be measured.
Comparable pack designs
08 Tausta-aineisto/02 Akku - rakenne ja valmistus/ — West 2016 (FSAE WR-217e, Wisconsin, 45 pp.); Cooke 2012 (400 mph landspeed pack, Ohio State, 115 pp.); keenlab kCap capacitive spot-welder handbook
Reference structures and a checklist of what a pack design has to demonstrate. Used as comparison points rather than as sources of numbers.
Darcy 2016 and 2018 — NASA
08 Tausta-aineisto/03 Akku - lampo ja turvallisuus/
Design guidance for safe 18650 packs and for preventing thermal runaway propagation, including three architectures for propagation resistance. Our cold-plate arrangement is the interstitial heat sink architecture. Also the source for the argument about vent direction when a cell has no bottom vent.
Gaia 2017 — Tukes report (in Finnish)
08 Tausta-aineisto/03 Akku - lampo ja turvallisuus/
Lithium-ion safety factors: hazard mechanisms, standards, regulation, firefighting and the authority's perspective. The only source in the collection tied to the Finnish regulatory environment, and the right starting point for a risk assessment.
Frame, swingarm and materials
08 Tausta-aineisto/04 Runko ja mekaniikka/ — Kawata 2015 (SAE-JSAE, Suzuki MotoGP); Ramos 2016 (IST Lisboa); Mäennenä 2015 (MSc, TTY, in Finnish); Yamaha YZF-R1 2020 race kit manual; DIN 5480-1 (2006)
Kawata on reducing frame lateral stiffness without losing longitudinal stiffness. Ramos on swingarm design with Cossalter's stiffness ranges (Klat 0.8–1.6 kN/mm, Ktors 1–2 kNm/°) and achieved masses. The R1 manual is the original source document for the inherited swingarm, linkage and geometry. DIN 5480 for the splined hub joint.
Adhesive design guide and datasheets
08 Tausta-aineisto/04 Runko ja mekaniikka/Henkel Loctite - Metallien liimaliitosten suunnitteluopas (v6).pdf
3M DP460 / DP460NS / DP100 Plus Clear datasheets
Joint design for bonded metal, and the hot shear, peel and glass-transition figures behind the adhesive choice in chapter 8.
Rules and regulations
IEC 60034-18-41:2014 — Partial discharge free electrical insulation systems (Type I) used in rotating electrical machines fed from voltage converters
International Electrotechnical Commission; public preview read 28 Sep 2026
Qualification of Type I motor insulation for inverter supply. Annex B applies enhancement factors to the operating voltages to set test voltages; the worked examples use EF 1.25. Only the preview was read, so the book states the example value and not a normative one. Used in chapter 05.
FIM 2023 — technical guidelines for electric motorcycles
08 Tausta-aineisto/06 Saannot ja vaatimukset/FIM 2023 - Sahkomoottoripyorien tekniset ohjeet (CTI Guidelines 20.12.2023).pdf
Insulation resistance, equipotential bonding, capacitor discharge, fuse placement, ingress protection, markings and warning lights, emergency stop, RESS test evidence and EMC. Status in this project: since the bike is a technology demonstrator rather than a series entrant, this is a design guide rather than a scrutineering requirement, with markings, breaking capacity and electrical work safety kept binding by choice. If the bike enters an event, the organiser's requirements apply.
FIM 2024 — electrical seminar, fundamentals and PPE
08 Tausta-aineisto/06 Saannot ja vaatimukset/FIM 2024 - Sahkoseminaari Mies, perusteet ja PPE.pdf
Technically below the level of the rest of the material, but the paddock PPE and equipment list is directly usable as a procurement list: class 0 gloves to IEC 60903, insulating mat, rescue hook to IEC 61235, voltage tester, CO₂ extinguisher and a lithium-rated extinguisher.
Motorsport UK 2020 — electric vehicle regulations and organiser guidance
08 Tausta-aineisto/06 Saannot ja vaatimukset/
Wrong sport and wrong country, kept for one reason: it covers the event organiser's perspective on paddock operations more thoroughly than the FIM material does.
Suomen Road Race Ajajat ry — Retro Superbike class
srra.fi/retro-superbike, checked 28 Sep 2026
The class organiser's description: motorcycles of model year 1999 or older, 1990s superbikes such as the Kawasaki ZX-7R, Suzuki GSX-R 750, Ducati 916 and 996, from near-stock to full superbike specification, in keeping with the period. Used in chapters 01 and 02 to define the Retro SBK rung of the KymiRing ladder.
Other
Metallitekniikka 5/2020 — feature article on the project
08 Tausta-aineisto/07 Media ja historia/
Cited for one number: the original 150 kg mass target from 2020. Useful precisely because it's contemporaneous — it records what the team believed at the start, which is what makes the mass history in chapter 9 legible.
Platform-project presentation — JHC Ukkonen Electric Superbike
JHC_UKKONEN_ELECTRIC_SUPERBIKE.pptx
The project's own outward-facing one-slide summary. Source of the cover photograph (by Tero Saarinen) and of the statement of purpose in the opening section: a practical annual project alongside students' theoretical coursework, more than fifty people involved in building it, and testing at the Imatranajo international road race and at KymiRing.
Internal charging study, September 2026
Project working document
The energy, voltage and power a trackside charging arrangement has to provide for this bike, and the practical options for providing it. Background to the charging question in chapter 11 and the checklist.
56. Imatranajo IRRC, official timing — "Three Flashes" race, 1–3 July 2022
MyLaps / Race Monitor session results, checked 21 Sep 2026
Qualifying 1: #18 Pauli Pekkanen (JHC Ukkonen) 2:22.548 on 3 laps; #95 Jörn Hamberg (Delta XE) 2:26.923 on 1 lap. Qualifying 2: Pekkanen 2:20.768 on 4 laps; Hamberg no timed lap. Race: Hamberg 3 laps in 7:30.201, best lap 2:28.783; Pekkanen 3 laps in 9:04.667, best lap 2:32.299, 1:34.466 behind. Both qualifying sessions were run together with the ICGP class. Used in chapters 06, 08 and 11. Marked by the timekeeper as provisional.
Etelä-Suomen Sanomat, 25 August 2024 — "Eemeli Lahti kruunattiin Suomen mestariksi"
Tuomo Seppänen (in Finnish); copy in 08 Tausta-aineisto / 07 Media ja historia
Mk3's rider's competition record, reported two weeks after he rode the bike at KymiRing: the 2024 Finnish Superbike title, four wins from six races, 130 points to 101; and the career behind it — Ajo academy from 2007, the 2008 Finnish MiniGP cup, a national 125 bronze, European and world 600 championships and the British series with one win and several podiums, European Superstock 600 silver in 2016, Used in chapters 00 and 02. The article predates the 2024 Bol d'Or, which is referenced separately (BIKEBOL).
Uutisvuoksi, 29 June 2023 — feature on Pauli Pekkanen and Markku Saarinen
Anssi Silvennoinen, "Imatran ajojen erikoismiehen Pauli Pekkasen huippupyörä rakentuu Lappeenrannassa" (in Finnish); copy in 08 Tausta-aineisto / 07 Media ja historia
The riders' and the mechanic's own racing record as reported by a local newspaper: Pekkanen's thirteen years of racing, seven in Britain, his Imatranajo results, and Saarinen's history as his chief mechanic from 2010, including the bike built from gathered parts in three days in 2018. Used in chapter 00 for the case that experienced people are the cheapest performance a student team can buy. A newspaper feature, not a record of results; the race results themselves are in the timing sources.
Lightning Motorcycle — factory visit, January 2024
Several hours of discussion with the Lightning team; the project's own notes of the visit
Recollection of a conversation, recorded as such. The one thing taken from it into this book is that the hosts recognised the crossed-resolver symptom from a verbal description and identified its consequence for field weakening unprompted. Used in chapter 10. No technical figure is taken from the visit.
Research proposal draft — externally coupled liquid cooling for high-power DC charging (not submitted)
08 Tausta-aineisto/EMRC-hakemus.docx — application draft for the Electric Mobility Research Center, 2026
Proposes an external cooling loop coupled to the bike's closed battery circuit through a quick-connect at the charging point, via a liquid-to-liquid heat exchanger, to run pit-stop-length charging at up to 80 kW under a strict pack temperature limit; nine to twelve months, with the pack built on the centre's 6S4P module tests. Never submitted. Used in chapter 11 as a further-development idea only.
Reserve rider's qualification statement, September 2022
Written statement to the J. Hyneman Center, in the project's files
The rider's own written account of his competence before riding the bike: racing experience, competition licence, road-licence categories, track experience and the capacity in which he took part. Used in chapter 11 as an example of a rider-qualification record. Private; its details are not reproduced. No technical figure is taken from it.
Project diary, 2022 test and race season
08 Tausta-aineisto / 07 Media ja historia — four contemporaneous accounts: the first and second test days at Motopark (June 2022), the public launch run at Lappeenranta airfield (30 June 2022), and the Imatranajo race weekend (1–3 July 2022), the last including the project lead's written report to the centre's Professor of Practice
The project's shared diary, written as it happened, most of it by Terhi Virkki-Hatakka rather than by the engineers, which is why it holds things the telemetry does not: the rider's comments verbatim, paddock temperatures (controller 70 °C at the first test, 102 °C at the second, gearbox 50 °C, battery 34 °C), the inverter's per-straight current derate (300 A to 150 A in 6–9 s) and 40 °C temperature swings, the team's estimate that at most half the power was available, the competitor's top speed and its ice-packed battery, the final-straight crash, and the race-day logistics. Recollection and contemporary estimate, not instrumentation. Every figure taken from it is attributed in the text as a contemporary account, and where official timing or logged data exists, that is used in preference.
Electric Superbike Twente — published specifications
Team and press material for the Delta-XE (2021) and Apex-RS; and the team's own live race blog from KymiRing, Live: Finland Race 2024, the team's live blog from the KymiRing meeting of August 2024 (the page itself is dated 2 Aug) — electricsuperbiketwente.nl/live-finland-race-2024/, read 22 Sep 2026
Delta-XE, the machine that won at Imatra in 2022: 150 kW, 220 kg, 13.5 kWh, 800 V, PMAC. Apex-RS, the following generation: 150 kW with 120 used, 190 kg, 13.2 kWh, 700 V. These are the team's own published figures and are treated here as claims rather than measurements; they are used for the voltage and mass comparison, which the race result independently supports, and for nothing finer. The same applies to the KymiRing 2024 figures used in chapter 01, which come from the team's own live blog and not from official timing: 311 km/h on the first push lap and a best of 2:15.146 after two, both on wet-weather tyres, on the track day that followed the rained-off race and which Ukkonen did not attend. The 2:16 on slicks used alongside Mk3's 2:02 is from the day the two machines shared the circuit and comes from the project's own account and the university's, not from this blog. Their machine that weekend was the Vector-ST.
Bike.fi, 4 July 2023: “Pauli Pekkanen: Paukku Racingista Imatranajon historian menestynein tiimi”
Janne Huhtala (in Finnish); bike.fi/pauli-pekkanen-paukku-racingista-imatranajon-historian-menestynein-tiimi/, read 24 Sep 2026
Pekkanen's 2023 Imatranajo: three wins from three starts, two in IRRC Supersport and one in Supersport Open, with Markku Saarinen as the bike's builder. Used in chapter 00.
Bike.fi, 16 September 2024: “Lahti palkintokorokkeelle Bol d’Orissa”
In Finnish; bike.fi/lahti-palkintokorokkeelle-bol-dorissa/, read 24 Sep 2026
Eemeli Lahti at the 2024 Bol d'Or, Paul Ricard: team TRT27 AZ Moto, third in the Superstock class and seventh overall. Used in chapter 00.
Lightning LS-218 — Wikipedia
en.wikipedia.org/wiki/Lightning_LS-218, read 24 Sep 2026
The LS-218's 218 mph at Bonneville, its listing as the fastest production motorcycle, and the 2013 Pikes Peak International Hill Climb win in open competition. Used in chapter 01. An encyclopaedia entry: the article's own references are the primary sources, and a later revision should cite those directly.
Bike EXIF — “Silent Hooligan: Meet the Lightfighter V3-RH”
bikeexif.com/lightfighter-electric-race-bike, read 24 Sep 2026
Lightfighter V3-RH specification as published: 162 Nm at the motor output shaft and 324 Nm after an integral 2:1 gearbox, a Parker Hannifin motor, 186 kg dry. Used in chapter 01. The team's own figures as reported by a magazine.
Farasis Energy — “Charging Ahead: Pouch cells save 20 % on space”, Lightfighter success story, February 2024
farasis-energy.com (PDF), read 24 Sep 2026
The cell supplier's account of Lightfighter's pack: Farasis P32 pouch cells, and the paddock routine of charging and cooling between races. Used in chapters 01 and 07. A supplier's marketing document; used only for the cell format and the between-race cooling.
Kempower — Liquid-Cooled Satellite
kempower.com/solution/liquid-cooled-satellite/, read 24 Sep 2026
A production DC charging satellite with a liquid-cooled cable and connector, rated to 500 A. Used in chapter 11 as the evidence that the charging cable is already liquid-cooled in current products.
Motorradonline, 21 February 2024: Electric Superbike Twente, the team's machines 2019–2023
Jens Kratschmar (in German); motorradonline.de/elektro/electric-superbike-twente-vector-st/, read 24 Sep 2026
Pack figures for each generation of the Dutch team's bikes, including that the 2022 Delta-XE used a self-developed pack of lithium-polymer pouch cells (576 cells, 800 V, 13.5 kWh). The article does not state the Vector-ST's cell format. Used in chapter 07.
Lightfighter Racing, 6 February 2026: “How Fast Is Fast? Lightfighter RH at Chuckwalla”
Jensen Beeler; lightfighter-racing.com/post/how-fast-is-fast, read 24 Sep 2026
A competing electric race team's own account of why an electric lap time needs its conditions stated: single flying lap against race distance, qualifying against worn tyres, state of charge, and whether the pack was pre-cooled. Used in chapter 01 as independent support for the five-variable warning and for Lightfighter's pre-cooling. Contains no lap times.
Lightfighter Racing — V3-RS specification
lightfighter-racing.com/v3-rs, read 24 Sep 2026
The manufacturer's published specification: 181 kg, 115 kW, 162 Nm at the motor with a 2:1 reduction, 16 kWh Li-NMC battery, about one hour to charge. Used in chapter 01. The team's own figures.
RideApart — "This EV motorcycle maker's sole purpose is racing"
rideapart.com/news/773360/lightfighter-racing-electric-motorcycles, undated online, checked 28 Sep 2026
Article on Lightfighter's V3-RS and V3-RH, which share one pack: Farasis NMC cells, "nominal voltage sits at 383V, peaking at 440V, with more than 300A of peak current available." Used in chapter 06. The manufacturer's own specification pages do not state the voltage.
LUT Voima — LUT School of Energy Systems
lut.fi/fi/tutustu-meihin/tiedekunnat/lut-school-energy-systems/lut-voima, checked 28 Sep 2026
The university's prototype workshop and laboratory: equipment building for experimental research, electronics, design and calibration, open to researchers, students and companies. What it has made for this project is from the team's own account (TEAM). Used in the closing section.
New Atlas, 8 October 2025: “The Lightfighter V3: Pure race DNA made into an electric weapon”
Ian Baker; newatlas.com/motorcycles/lightfighter-v3rs-v3rh/, read 24 Sep 2026
V3-RS at 181 kg ready to race with 115 kW, compared by the makers with the Ducati Panigale V2; V3-RH at 100 kW for Super Hooligan; a 12.5 kWh battery good for about seven minutes at full throttle. Used in chapter 01. The battery figure differs from the team's specification page (LFV3), and both are given.
YASA — P400 R product sheet, rev 14
yasa.com/media/2021/05/yasa-p400rdatasheet-rev-14.pdf, read 24 Sep 2026
Public datasheet of an axial-flux motor: 28.2 kg, up to 370 Nm peak at 450 Arms and 200 Nm continuous, 160 kW peak at 700 V, 8 000 rpm. Used in the motor comparison in chapter 05, with Kt derived from the datasheet (370 / 450 = 0.822 Nm/Arms), not measured.
EMRAX 228 datasheet, v1.7 (MV)
05 Komponenttidokumentit/Vanhat ja ei kaytossa/
Public datasheet of the smaller EMRAX: 220 Nm at 360 Arms, 6 500 rpm, 13.5 kg. Used in chapter 05 to show that a smaller motor from the same range is not a shortcut. Kt derived from the datasheet (0.611 Nm/Arms), not measured.
LUT press images — President Alexander Stubb's visit to LUT University, 29 January 2025
lut.pictures.fi, gallery “Presidentti Alexander Stubbin vierailu”; photographs © Teemu Leinonen; read 24 Sep 2026
Photographs of the visit, including the President seated on the bike. Used in the closing section. The photographs themselves are not reproduced in this book.
MotoGP.com, 11 September 2025: “MotoE™ to go on hiatus following 2025 season”
motogp.com/en/news/2025/09/11/motoe-to-go-on-hiatus-following-2025-season/758591, read 25 Sep 2026
The promoter's announcement that the MotoE World Championship would pause after the 2025 season. Used in chapter 01 for the state of the field in 2026.
Finnish Meteorological Institute — monthly statistics, July, 1991–2020 reference period
ilmatieteenlaitos.fi/heinakuu, read 25 Sep 2026
Mean July temperature of about 17–18 °C in southern Finland and 16–17 °C in central Finland. Used in chapter 08 as the background to the project's working design ambient of about 22 °C for a daytime race; the 22 °C itself is the project's estimate, not a statistic.
LUT University — project articles, 2023 and 2024
lut.fi articles on the Mk1 track test and on the 2024 KymiRing session, checked 21 Sep 2026
The rider's own assessment of Mk1 (that its weight made it hard to turn into a corner) and the contemporary account that the controller overheated during the 2022 race and cut power to about half. Also the 2024 KymiRing result, where Mk3 lapped in 2:02 against the Dutch team's 2:16 on the same day. Their machine went a second quicker on the following day's track day, which Ukkonen did not attend; see TWENTE. Press figures for power and top speed in these articles are higher than the project's own measurements and are not used.
J. Hyneman Center project team — account for this edition, September 2026
Supplied by the project lead while revising the handbook, 23 Sep 2026
Facts about the project's organisation and manufacture that no other document in the collection records: that the frame is the project's own design, made from welded billet parts in 5083 aluminium by LUT Voima, carried Mk1 to Mk3, and was laid out around the motor position and Mk1's cell count; the events where the bike has been shown; how students join and leave the project; how the bike is developed part by part; and the staff's roles. Added 25 Sep 2026: the rider's requests after the first KymiRing session in 2024 (ride height, and the rear brake on a left-hand lever, fitted before the August session); that the 2:00.50 calibration lap is the logged 2:02.588 less the rider's traffic estimate, verified from sector times; the brakes being from Brembo's racing range; and the account of the 2023 DC_Volt_Limit episode. No performance figure is taken from it.
Centre-of-gravity height on a motorcycle: provisional general references
K. Cameron, “Motorcycle Center of Gravity Motorhead Myths”, Cycle World, updated 4 Nov 2020, cycleworld.com; “Bicycle and motorcycle dynamics”, Wikipedia, read 23 Sep 2026
General background for the warning in chapter 09 that a low CG is not automatically better: Cameron's argument that low CG is not the answer for a quick-handling sportbike, and the textbook relationships between CG height and lean angle with wide tyres, and the wheelie and stoppie limits. Provisional: to be replaced by the corresponding pages of Spalding's MotoGP Technology (see SPALD) once the project's copy is available again; open item O18.
What carries no reference
Four kinds of statement in this handbook don't carry a citation, and it's worth being explicit about which:
- General engineering relationships: the power equation, Arrhenius behaviour, laminar heat transfer scaling with channel height. Textbook material, not project findings.
- The order of work in chapter 4 and the method in chapter 12. These are the project's own working conclusions rather than anything measured. They're the part most likely to be wrong for a differently shaped team.
- The generalisation in each Rule block. Each one grew out of the example beside it, but the step from one case to a general rule is a judgement and not evidence.
- The explainer boxes, headed “In plain terms”. Standard definitions, written out rather than cited. Any textbook on electrical machines or battery engineering covers them properly, and should be preferred over these summaries for anything you're going to calculate with.
Scope and limits
The absolute numbers in this handbook come from one project: a lap simulation calibrated on one circuit, three built generations of one motorcycle and the design of a fourth, and three cell types. The orderings, the ratios between items and the sequence of design decisions are transferable; individual seconds and watts are not. Where a figure is contested within the project's own material, it is marked as contested rather than resolved in favour of one source, and the errata page lists every such case that is still open.
Licence, credit and how to cite
Text, tables, diagrams and data: Creative Commons Attribution 4.0 International (CC BY 4.0). You may copy, adapt and reuse them, including commercially, provided you credit the author and this publication and indicate whether you changed anything. Student teams are the intended beneficiaries of that: take the checklist, take the order of work, take the requirement list, and adapt them to your own machine.
The photographs are not covered by that licence. Each remains the property of the photographer named in its caption and is reproduced here by permission for use in this publication only. They may not be reused, redistributed or adapted under CC BY; ask the photographer. If you republish part of this book, remove the photographs or obtain permission separately.
Cite it as: Kasurinen, M. How to design a fast electric race motorcycle. J. Hyneman Center, LUT University, revision 1.0, 2026. Cite the revision number: the book will be revised, and the errata page records what changes between revisions.
Photographs. Cover, Mk3 at KymiRing in chapter 01, and the pit-lane and garage photographs in chapter 11 by Tero Saarinen; Mk1 at the Lappeenranta airfield launch in chapter 00 by Marko Kasurinen; Mk1 at Imatranajo in chapter 08 by Eero Scherman; Mk2 at the airfield in chapter 11 from the project's own material DECK. They are in the book to show things the figures cannot — what the machine looks like leaned over, and how many people are standing round it when it comes in.
Use of AI. This handbook was compiled and edited with the help of generative AI assistants. They were used to organise the project's material into chapters, to draft and edit the English text, to cross-check figures against the source files (the workbook, the logs, the configuration files and the datasheets), to build this page and its diagrams, and for independent read-throughs of the draft. They did not produce any of the measurements, logs or test results the book reports, and none of the photographs is AI-generated. Every technical claim was checked against the source cited beside it, and the author is responsible for the content, including its errors; a correction goes on the errata page like any other.
Written by Marko Kasurinen, Head of Development at the J. Hyneman Center, LUT University. Revision 1.0, 30 September 2026.
Revision history
- 1.0, 30 September 2026: first public revision.
New material goes in with a reference key, following the conventions set out in chapter 12.